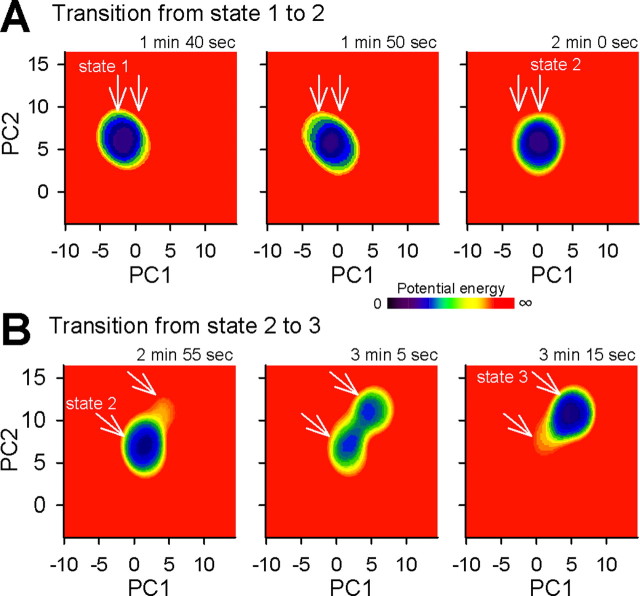
Figure 11.
Time-varying potential energy of network states. The raster plot shown in Figure 2A was analyzed. A, B, The low potential area (cold color) moved to a new locus during the transition from state 1 to 2 (A) and state 2 to 3 (B). See also supplemental movie 2 (available at www.jneurosci.org as supplemental material).

