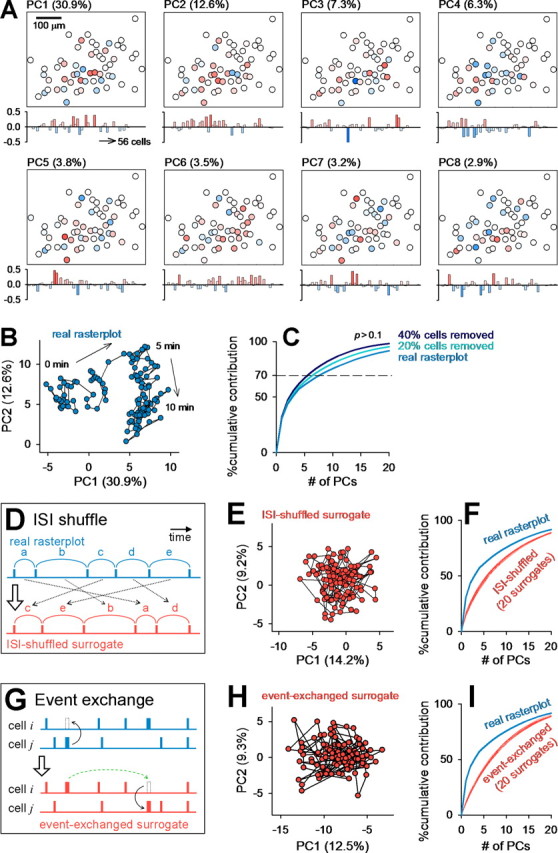
Figure 3.

PCA-defined network states are nonrandomly organized. The raster plot shown in Figure 2A was analyzed. A, Cell maps (top) and pseudocolored eigenvectors (bottom) of the first eight PCs that accounted for >70% of the total variance. Values in the parentheses indicate contribution ratios to the total variance. B, Spatiotemporal patterns of spontaneous activity illustrated in the two-dimensional PC1–PC2 space. C, A portion (20–40%) of neurons were randomly selected and removed from the raster plot, and PCA was performed for the remaining neurons. This cell-ablation procedure did not significantly affect the contribution ratios of PCs. D, ISIs were transposed at random within cells to collapse temporal correlations between the events. E, PCA of a surrogate raster plot generated by the ISI-shuffling procedure. For this surrogate, we determined a new set of eigenvectors and depicted the data in a new PC coordinate. F, The contribution ratios of the original raster plot were higher than those of ISI-shuffled surrogates. Simulations were repeated 20 times, and all data are represented as red lines. G, A cell event was exchanged with a randomly selected event of another randomly selected cell, and this procedure was repeated for all events of all cells to randomize the raster plot while preserving both the activity levels of individual cells and the temporal correlation at the population level. H, PCA of a surrogate raster plot generated by the event-exchanging procedure. I, The real contribution ratios were higher than those of any of 20 event-exchanged surrogates.
