
Figure 1.
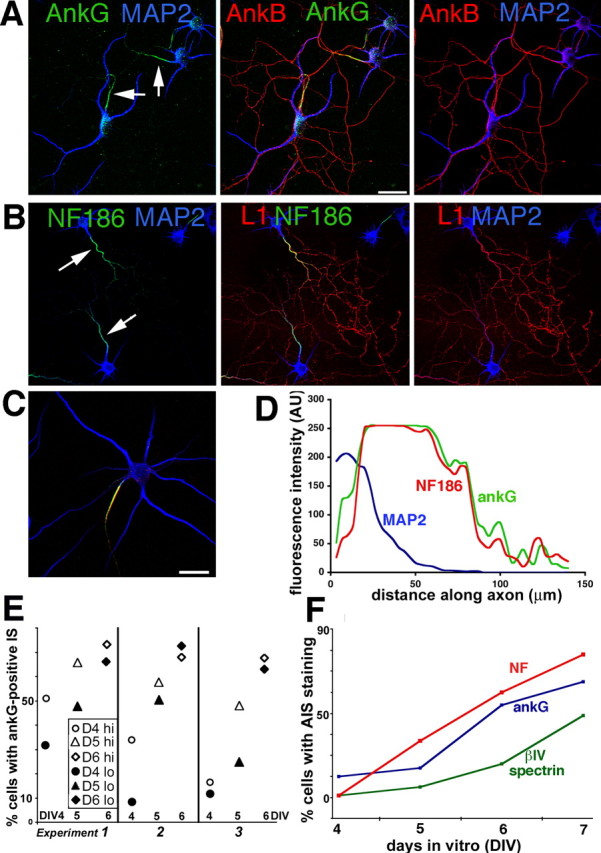
Differential distribution of L1 family members and ankyrins in cultured hippocampal neurons. A, B, Hippocampal neurons cultured in vitro for 10–12 d (DIV) were stained with antibodies against the L1 family members L1 (red) and neurofascin (green) (B) and against ankyrinG (green) and ankyrin B (red) (A). MAP2 was counterstained in blue to indicate the location of soma and dendrites. ankB and L1 are found enriched along axons, whereas ankG and NF are found enriched on the axonal IS (see arrows). C, D, The staining intensity of cells triple stained with antibodies against MAP2 (blue), NF (red), and ankG (green) were analyzed by line intensity scans using NIH ImageJ software. A typical cell is shown. Tracings were started at the soma/hillock boundary and extended for 80–100 μm along the axon. The intensity of NF (red profile) and ankG (green profile) closely align along axons of stage 4 neurons. The IS, as delineated by ankG and NF staining, measures ∼60 μm. MAP2 (blue profile) staining, in contrast, falls off sharply at the axon hillock. Scale bars, 50 μm. E, Density of neuronal cultures influences the time course of ankG accumulation at the IS. Cultures were plated in 60 mm dishes containing several coverslips at two different densities [hi, 200,000 cells per 60 mm dish (open symbols); lo, 100,000 cells per 60 mm dish (filled symbols)], and one coverslip was removed from the same dish at consecutive days (DIV4, circles; DIV5, triangles; DIV6, diamonds) and stained against ankG. The results are shown for three independent cultures. Despite variability, the low-density (filled symbols) cultures showed slower maturation of the IS in each experiment than the higher-density cultures (open symbols). F, Coverslips were fixed at consecutive days from the same culture and stained against NF (red), ankG (blue), and βIV-spectrin (green). The percentage of cells showing IS enrichment is shown for one such experiment.