
Figure 6.
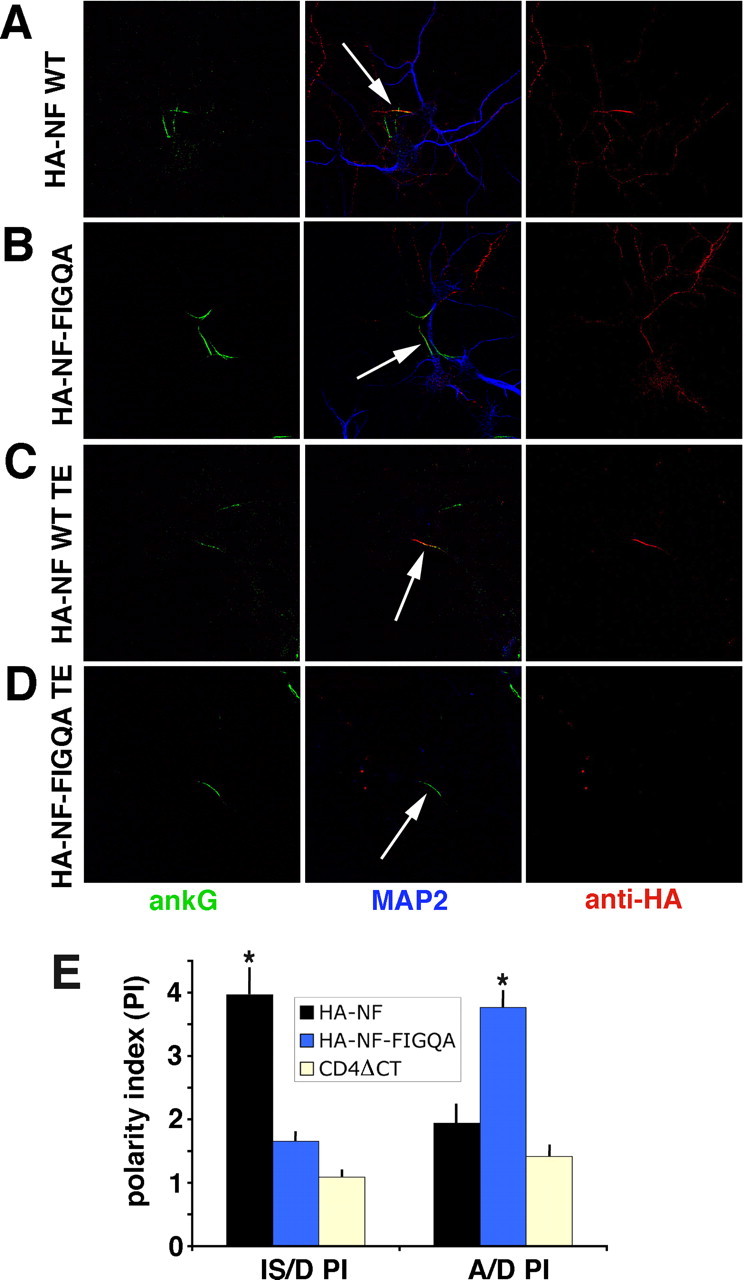
Mutation of the FIGQY motif of NF impairs IS localization and retention. A–D, NF–HA (A, C) or HA–NF FIGQA (B, D) were expressed in hippocampal neurons and either fixed directly (A, B) or fixed after live Triton X-100 extraction (TE; C, D). Anti-HA staining is visualized in red, ankG staining in green, and MAP2 staining in blue. Single red channel images (right), single green channels (left), as well as merged images (middle) are shown for easier comparison. Arrows indicate IS. E, The A/D PI and IS/D PI were calculated by dividing the average fluorescence intensity along stretches of distal axon or IS by the average fluorescence intensity along stretches of dendrites. Dendrites were identified by MAP2 immunoreactivity, and IS was identified by ankG immunoreactivity. All transfected cells were scored regardless of expression levels. The average polarity indices for wild-type (WT) HA–NF (black bars; n = 29 cells), HA–NF FIGQA (blue bars; n = 58 cells), and CD4ΔCT (yellow bars; n = 34 cells) are plotted. Error bars indicate the SEM. *p < 0.001, statistically significant difference from CD4ΔCT by Mann–Whitney U test ().