
Figure 1.
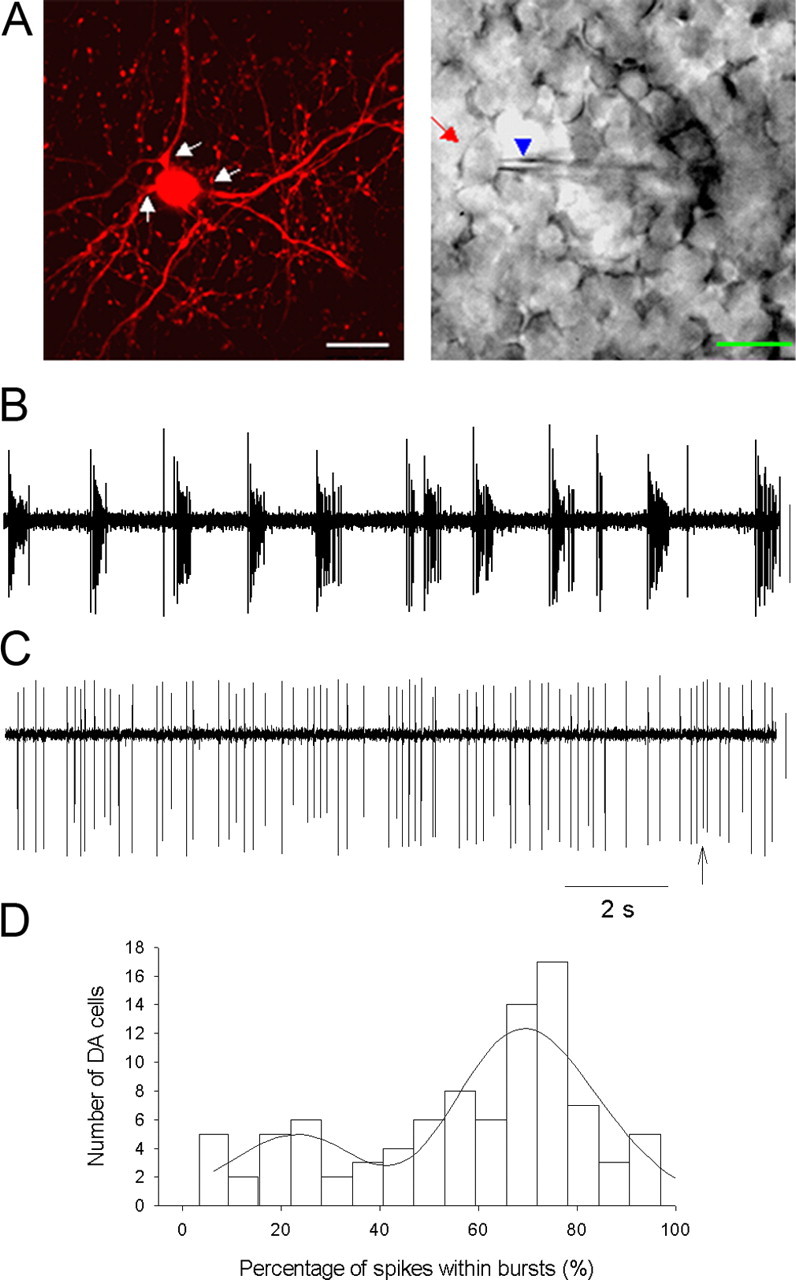
Spontaneous spiking/bursting of DA neurons in the dark. A, Fluorescence (left) and infrared (right) images of DA neurons in TH:RFP mouse retinal whole mounts illustrating cell targeting and recording. Arrows in the fluorescence photomicrograph point to the main processes of a DA cell. The arrow (red) and arrowhead (blue) in the infrared image point to the soma of the TH::RFP-expressing cell and the recording pipette, respectively. DA cells in situ exhibited mixed single-spike/bursting patterns. Scale bars, 20 μm. B illustrates a recording dominated by bursting (firing rate 10.9 Hz, 94% spikes in bursts), whereas C is dominated by single-spike firing but also spikes containing bursts (arrow; firing rate of 4.6 Hz, 5% spikes in bursts). Loose-patch recordings were made using a voltage-clamp mode with the pipette holding a potential of 0 mV in this figure, as well as in the following figures. Calibration: 40 pA, 2 s. D, Histogram of percentage of spikes within bursts. DA cell spike trains yielded a two-peaked Gaussian distribution revealing low-bursting and high-bursting cell populations. The mean of the first peak was 22% spikes in bursts, whereas the second peak was 70% spikes in bursts.