Figure 3.
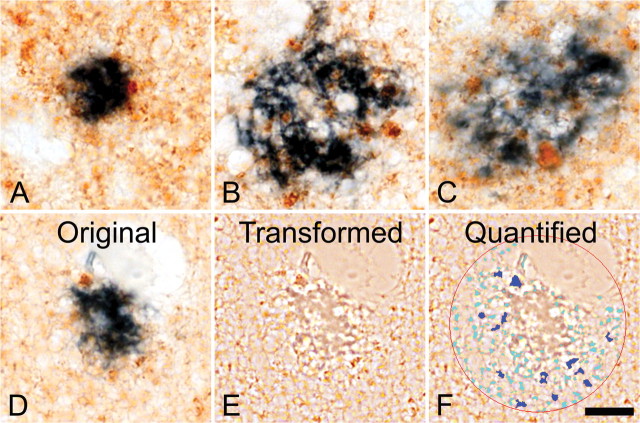
Double-immunohistochemical staining of glutamatergic dystrophic neurites (brown) and amyloid plaques (blue) in the midfrontal gyrus brain region. Note the predominant localization of dystrophic neurites to the inner areas of amyloid plaques, as opposed to the plaque periphery. Note also the increase in abundance of glutamatergic dystrophic neurites with increasing plaque size (A–C). D–F show the manner in which the relative abundance (total area of occupation) of glutamatergic dystrophic neurites was determined. E, The transformed file, which, as previously described, increases the computer's accuracy of detection. F, The encircled quantified area, in which dark blue coloration shows elements that met the required inclusion and exclusion criteria (size, color, intensity, saturation, and roundness) and were therefore included in the quantification. The light blue coloration shows elements that failed to match the necessary criteria and that were therefore excluded. Note the close level of overlap between computer detection and dystrophic neurite abundance, as well as the omission of smaller terminals or plaque fragments. Scale bar, 10 μm.

