
Figure 5.
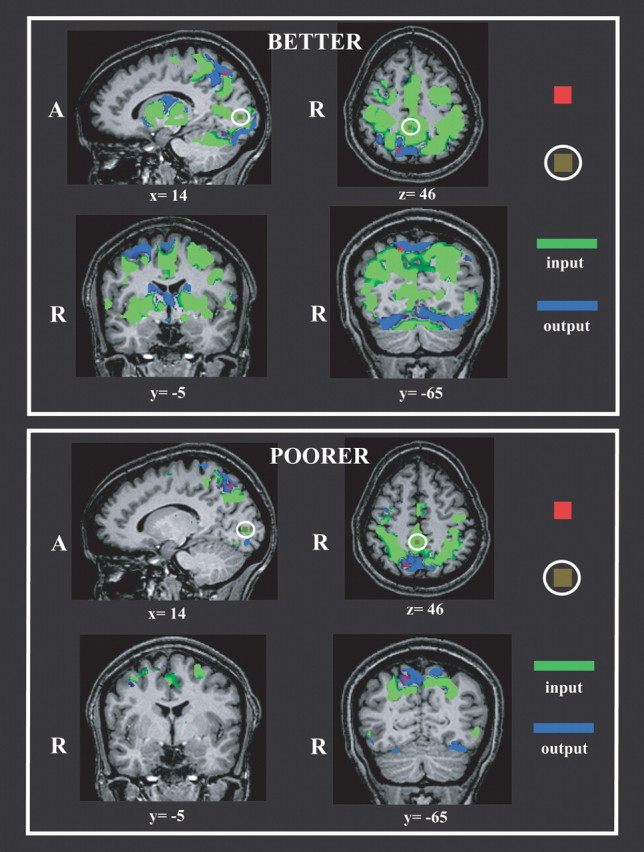
Bivariate Granger causality maps using the right pIPS ROI (red) as a reference. Representative slices are illustrated. Top, Better performers. Bottom, Poorer performers. Olive-green ROIs within white ellipses indicate location of medial parietal and right calcarine ROIs selected from these maps for subsequent multivariate Granger causality analyses. A, Anterior; R, right.