Figure 1.

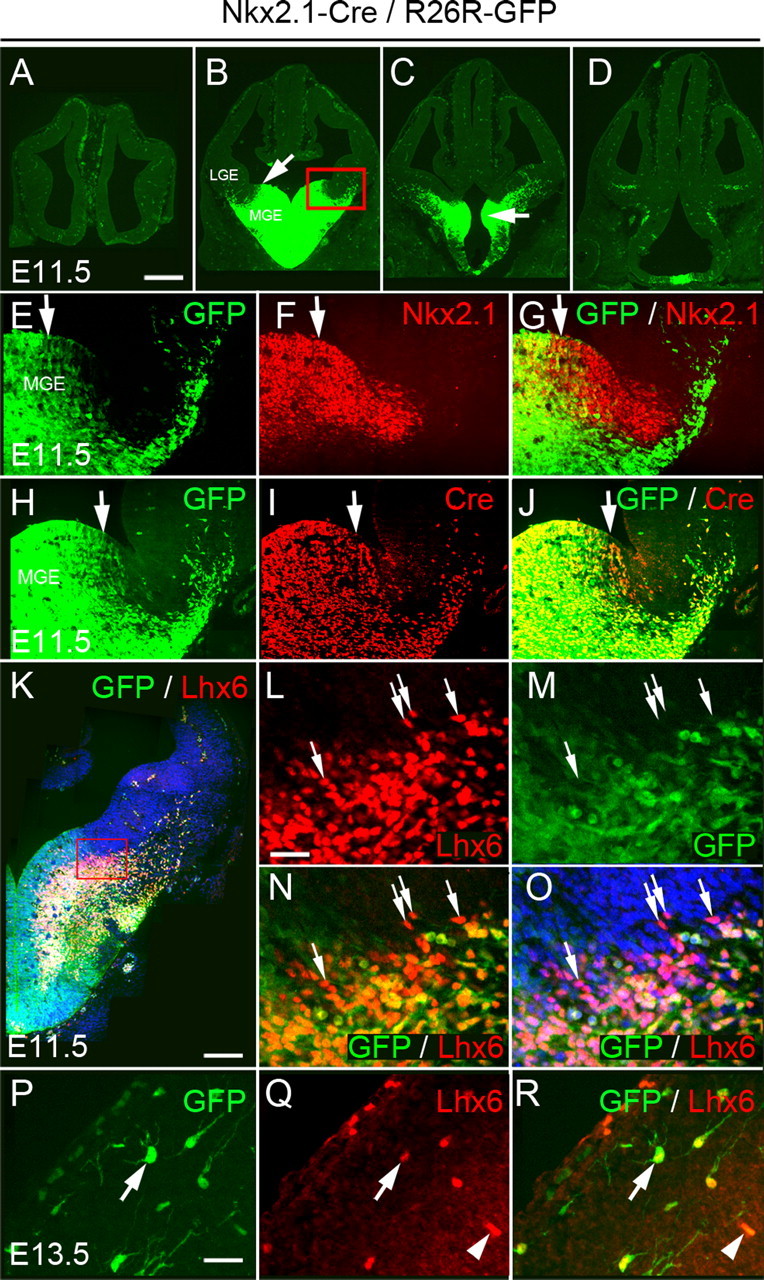
Activity of Cre recombinase in Nkx2.1–Cre/R26R–GFP transgenic embryos. A–D, Expression of GFP at four rostrocaudal levels in embryonic day 11.5 (E11.5) transgenic embryos. Arrow in B indicates the dorsal limit of GFP expression. Arrow in C shows expression in the AEP. The red box in B indicates the area shown in E–J. E–G, Comparison between the expression of the endogenous Nkx2.1 gene and GFP at E11.5. Nkx2.1 expression extends farther dorsally than GFP. H–J, Expression of Cre and GFP at E11.5. K–O, Expression of Lhx6 in E11.5 Nkx2.1–Cre/R26R–GFP transgenic embryos. Arrows indicate Lhx6+GFP− cells in the dMGE (L–O). P–Q, GFP+ cells in the cortex express Lhx6 (arrows). Arrowheads indicate blood vessels. Scale bars: A–D, 350 μm; E–J, 60 μm; K, 1250 μm; L–O, 25 μm; P–R, 15 μm.
