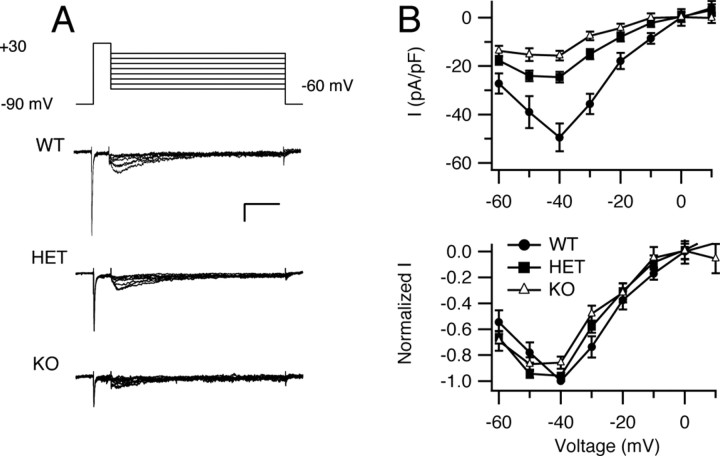
Figure 6.
Resurgent sodium current in Purkinje neurons of NaV1.1 WT, HET, and KO mice. A, Representative resurgent sodium currents evoked using a prepulse to +30 mV for 10 ms, followed by 100 ms repolarizations to potentials ranging from −60 to +20 mV. The holding potential was −90 mV. Calibration: 20 ms, 1 nA. B, Top, Mean peak resurgent sodium current density versus voltage curves for WT, HET, and KO neurons. Bottom, Normalized resurgent sodium current versus voltage curves for WT, HET, and KO neurons. Error bars indicate SEM.

