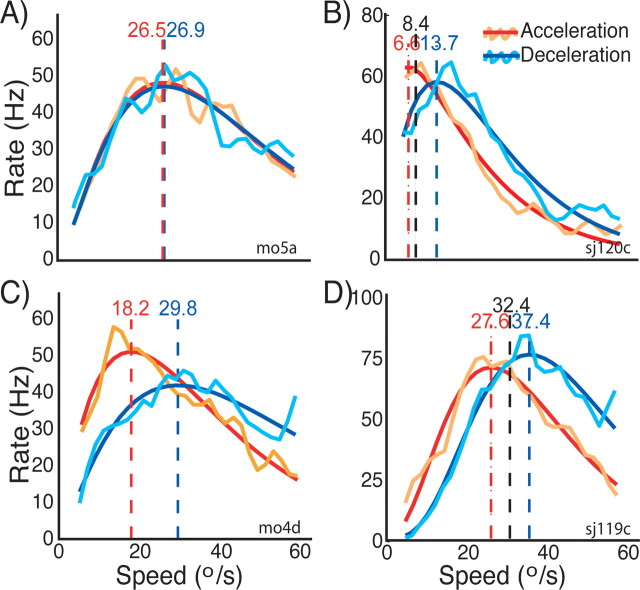
Figure 2.
Speed tuning of single neurons to stimuli with acceleration history compared with stimuli with deceleration history. Each of the four panels shows the tuning curves for one neuron. The orange and turquoise lines correspond to the spike density functions of the neurons during acceleration and deceleration stimulation, respectively. The red and blue lines are the corresponding fits to these spike densities. The vertical dashed red and blue lines with the numbers on top indicate the preferred speed estimates for the two conditions that we extracted from the fits (see Materials and Methods). In B and D, the two dashed black lines with numbers on top indicate the preferred speed determined with constant speed stimuli (see Materials and Methods). The neuron in A does not show any differences between the two conditions. However, there are obvious differences in the tuning curves in the other three neurons. The main effects of stimulus history that these neurons show are as follows: differences in the response strength (peak height); differences in the preferred speed; and differences in tuning width (for details, see Results).

