Figure 1.
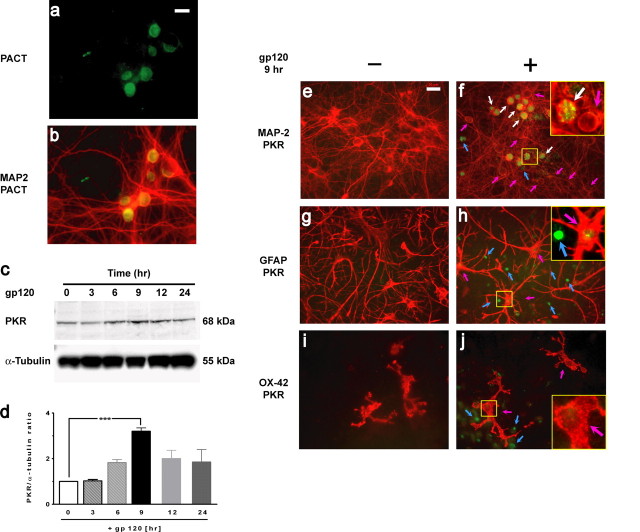
PACT and PKR expression in neurons. a, b, PACT (a; green) and merged image of PACT/MAP-2 (b) expression in neurons in cortical mixed cultures. c, PKR was upregulated in cortical cell cultures exposed to 200 pm gp120 in a time-dependent manner. Western blot analysis was performed on lysates, using α-tubulin as the loading control. d, Ratios between total PKR and α-tubulin were normalized to the value at time 0 h, and mean ± SEM (n = 4) is shown. ***p < 0.001. e, f, Double immunostaining with MAP-2 (red) and PKR (green) antibodies of control cortical cell cultures (untreated) and those exposed to gp120 for 9 h. Upregulated PKR (green) in neurons is indicated with white arrows and in glia with blue arrows. Neurons (red) without PKR induction are indicated with pink arrows. Analysis of 2000 neurons showed that the PKR is upregulated in 36 ± 1.1% of neurons exposed to gp120 for 9 h. g, h, Double immunostaining of cortical cultures exposed to gp120 with GFAP (red) and PKR (green) antibodies. Blue arrows indicate PKR induction in nonastrocytic cells, and pink arrows indicate astrocytes with extremely low PKR expression. i, j, Double immunostaining with OX-42 (specific for microglia, red) and with PKR (green). PKR upregulation in nonmicroglial cells (blue arrows) and microglia without PKR expression are indicated with pink arrows. In the cultures exposed to gp120 (f, h, j), higher-magnification images of the area outlined in yellow are shown in the insets. Scale bars, 20 μm.

