
Figure 6.
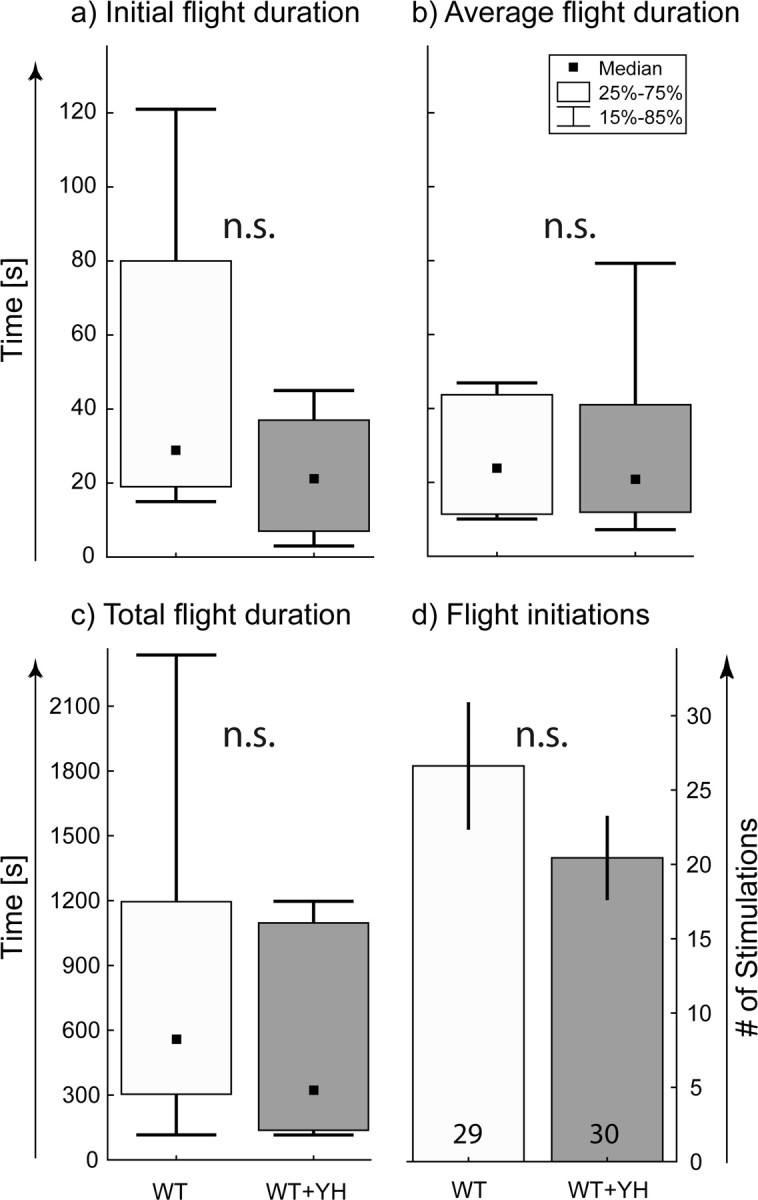
Blocking TA receptors in wild-type flies does not affect flight behavior. For a–c, the black squares indicate the median, the boxes signify the 25 and the 75 percentiles, and the error bars range from the 15 to the 85 percentiles. a shows the flight duration until the first stop in control wild-type flies fed with sucrose (WT; light gray bar) and for wild-type flies fed with the TA receptor blocker yohimbine (WT + YH; dark gray bar). b indicates the average duration of flight bouts for WT control and WT + YH flies. c shows the total flight duration for WT control and WT + YH flies. d shows the mean number of stimuli to which WT control and WT + YH responded with flight bouts before they did not respond to three consecutive stimuli (error bars are SEMs). n.s. indicates that no significant differences were found, Mann–Whitney U test.