
Figure 5.
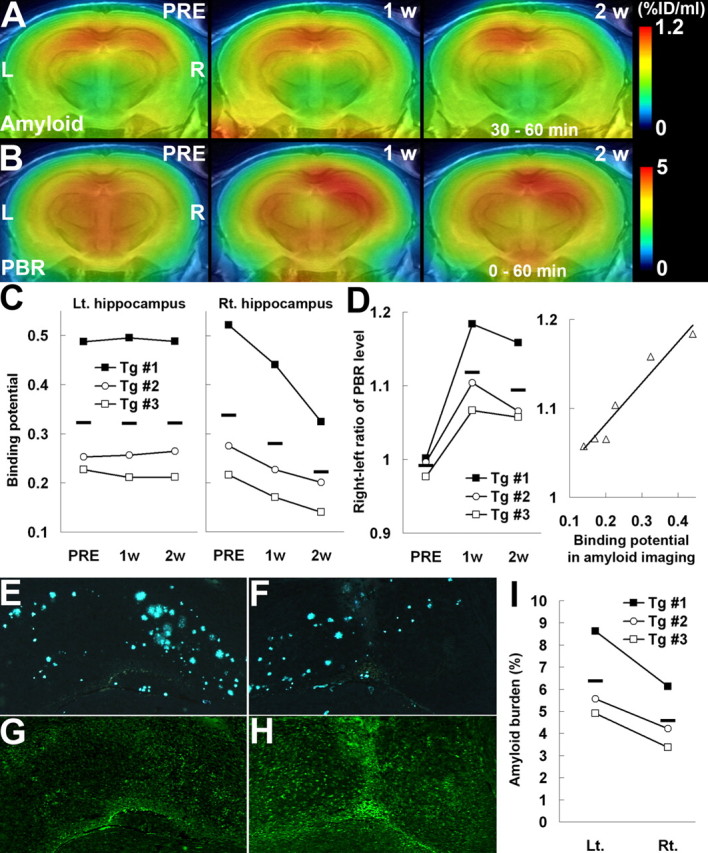
Amyloid elimination and glial activation during the course of anti-amyloid treatment as visualized by longitudinal PET scans. A, B, PET maps of [11C]PIB (A) and [18F]FE-DAA1106 (B) in a 20-month-old APP Tg mouse (Tg #3), generated by averaging dynamic data at 30–60 min (A) and 0–60 min (B), respectively, and superimposed on an MRI template. Images were obtained before (PRE; left), 1 week (1 w; middle), and 2 weeks (2 w; right) after passive Aβ immunization. Vehicle alone and anti-Aβ antibody were injected into the left and right hippocampi, respectively. L, Left; R, right. C, Time course of amyloid elimination quantified by multiple [11C]PIB PET scans during the course of anti-amyloid treatment. Binding potential in the vehicle-injected hippocampus remained unaltered (left; F(2,4) = 0.02 and p > 0.05 for main effect of time by repeated-measures ANOVA), whereas it was significantly reduced in the anti-Aβ antibody-injected hippocampus (right; F(2,4) = 7.56 and p < 0.05 for main effect of time by repeated-measures ANOVA). D, Ratio between [18F]FE-DAA1106 radioactivities (at 0–60 min after the radiotracer administration) in antibody- and vehicle-injected hippocampi, showing a markedly elevated neuroinflammatory response triggered by antibody injection (left; F(2,4) = 16.7 and p < 0.05 for main effect of time by repeated-measures ANOVA) and a close correlation between levels of neuroinflammation and amyloid at 1 and 2 weeks after treatment (right; R2 = 0.942; p < 0.01, t test). The solid line represents regression. E–H, Double fluorescence labeling of amyloid (FSB; E, F) and microglia (Iba-1; G, H) in the left (E, G) and right (F, H) hippocampi of a Tg mouse (Tg #1) at 2 weeks after immunization. I, Load of FSB-positive amyloid in the hippocampus, indicating a significant left–right difference (p < 0.05, t test). Horizontal bars in graphs represent mean values. Lt., Left; Rt., right.