
Figure 1.
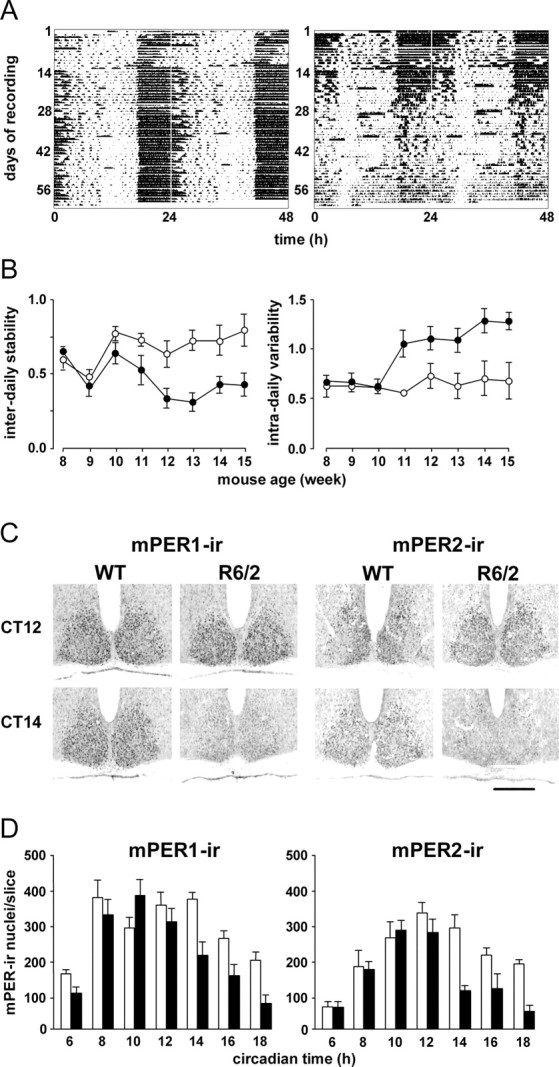
Disrupted activity–rest cycles and circadian expression of mPER1 and mPER2 in SCN of R6/2 mice. A, Representative actograms of WT (left) and R6/2 (right) mice held under 12 h light/dark cycle from 8 weeks of age onwards. Note progressive deterioration of activity profile in R6/2 mice. B, Group data (mean ± SEM) for interdaily stability (left) and intradaily variability (right) of WT (open circles) and R6/2 (filled circles) mice reveal significant deterioration from 11 weeks of age. C, Representative photomicrographs of SCN immunostained for mPer1 and mPer2 from WT and R6/2 mice samples at CT12 (projected lights off) and CT14. Note the early decline in mPER-immunoreactive (IR) in R6/2 mice. Scale bar, 500 μm. D, Group data (mean ± SEM; n > 3 per group) showing circadian rhythm of abundance of mPER1- and mPER2-IR nuclei in SCN of WT (open bars) and R6/2 (filled bars) mice. Note the early decline in mPER-IR in mutant SCN.