
Figure 2.
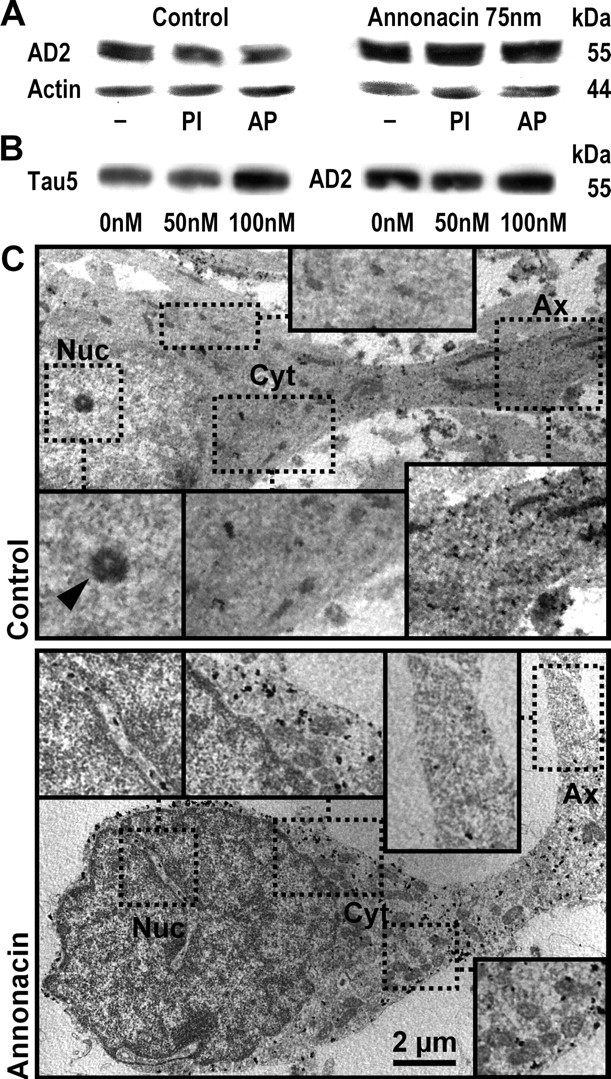
Biochemical and ultrastructural evidence that annonacin increases tau protein levels and induces the somatic redistribution of tau. A, Western blot analysis of cultured striatal neurons, grown under control conditions or treated for 48 h with 75 nm annonacin. The AD2 antibody labeled a single band at ∼55 kDa on 7% acrylamide gels, compatible with the fetal isoform of tau. Annonacin treatment increased the levels of AD2+ tau relative to actin. Protein extracts were prepared in standard lysis buffer (−), buffer containing phosphatase inhibitors (PI) to prevent tau dephosphorylation, or incubated with alkaline phosphatase (AP) to dephosphorylate tau. Under our experimental conditions, changes in the phosphorylation of tau could not be detected with the AD2 antibody. B, Western blot analysis of cultured striatal neurons, grown under control conditions or treated for 48 h with 50 or 100 nm annonacin. Protein extracts were prepared in lysis buffer containing phosphatase inhibitors. Both the Tau5 antibody, recognizing tau protein independently of its phosphorylation state, and the AD2 antibody labeled a single band at ∼55 kDa, which was increased compared with control conditions after treatment with 100 nm but not 50 nm annonacin. C, In a neuron under control conditions, immunogold labeling of tau by the AD2 antibody observed by electron microscopy shows abundant AD2 immunoreactivity (electron-dense black spots) in the axon (Ax) but not in the perinuclear cytoplasm (Cyt) or nucleus (Nuc; arrowhead, nucleolus). In a neuron treated with 50 nm annonacin for 48 h, AD2 immunoreactivity was sparse in the distal axon but very abundant in the perinuclear cytoplasm. As in controls, no AD2 immunoreactivity was observed in the nucleus (only in cytoplasmic invaginations into the nucleus). Immunolabeled fibrillary aggregates were not observed. Scale bar, 2 μm.