
Figure 3.
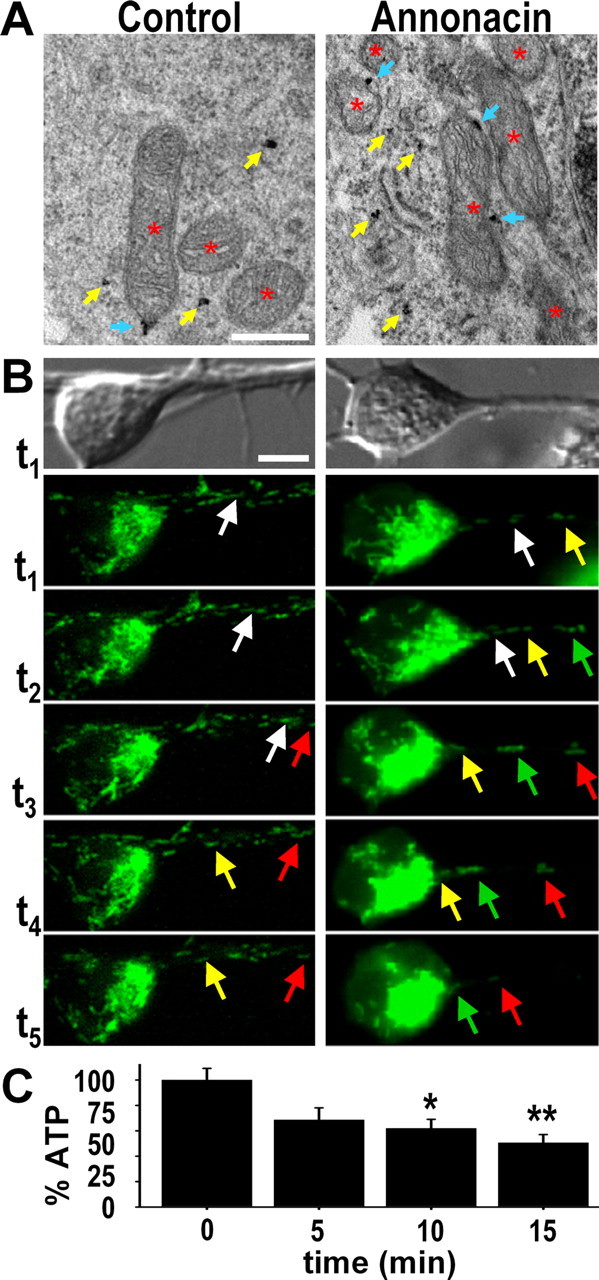
Annonacin causes somatic accumulation of mitochondria tagged with tau. A, Immunogold labeling of AD2+ tau visualized by electron microscopy shows an increased number of mitochondria (red stars) in the soma of a representative neuron from a culture treated for 48 h with 50 nm annonacin compared with a neuron from a control culture. Some of the mitochondria have AD2+ tau attached to their outer membranes (blue arrows). Yellow arrows indicate free AD2+ tau. Scale bar, 500 nm. B, Bright-field images of a representative control neuron and a neuron treated with 50 nm annonacin, followed by time-lapse video microscopy to show movements of mitotracker-stained mitochondria (green) in these neurons. In the control neuron, both anterograde and retrograde movements were seen. In contrast, only the retrograde movement of mitochondria from neurites to the soma was seen in the annonacin-treated neuron. Individual mitochondria are indicated in successive images with arrows of the same color. The images shown in this figure were taken at the following time points after addition of annonacin to the culture medium: t1, 1 min; t2, 10 min; t3, 50 min; t4, 80 min; t5, 140 min. The full movies are shown as supplemental data (available at www.jneurosci.org as supplemental material). Scale bar, 10 μm. C, ATP levels per milligram of protein in cultures exposed for 0, 5, 10, or 15 min to 50 nm annonacin, expressed as percentage of untreated control cultures. *p < 0.05, **p < 0.01 versus untreated controls.