
Figure 8.
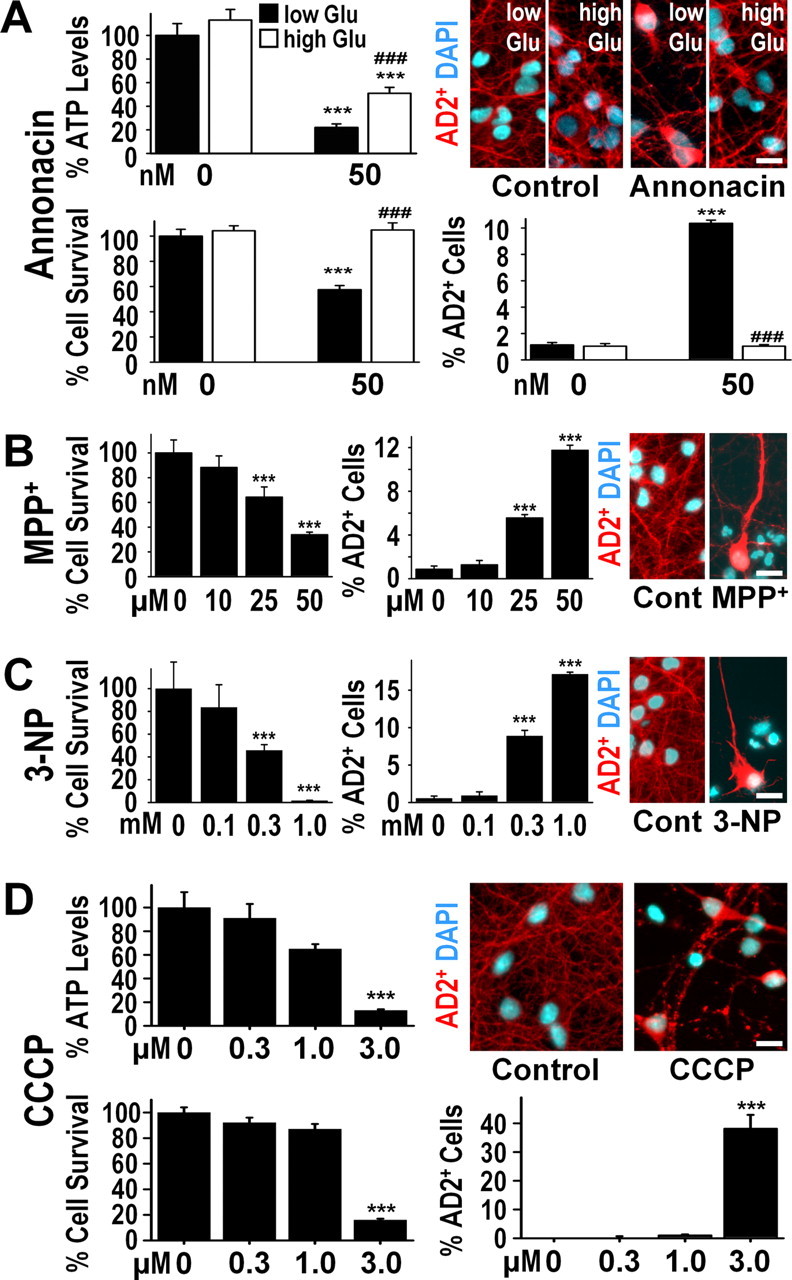
The annonacin-induced decrease in cellular ATP levels is responsible for the somatic redistribution of tau. A, ATP levels per milligram of protein (percentage of control levels), neuronal survival (percentage of control levels), and AD2+ cell bodies (percentage of all neurons) in cultures after exposure (6 h for ATP, 48 h for survival and AD2) to 50 nm annonacin in the presence of standard low glucose (Glu) concentration (250 μm) or a high concentration of glucose (50 mm) in the culture medium. ***p < 0.001 versus controls; ###p < 0.001 annonacin high glucose versus annonacin low glucose. The photomicrographs show representative cells with AD2+ tau (red) and DAPI+ chromatin (blue) in the different experimental conditions. B, Neuronal survival and AD2+ cell bodies in culture after a 48 h exposure to different concentrations of MPP+, an inhibitor of mitochondrial complex I. C, Neuronal survival and AD2+ cell bodies in culture after a 48 h exposure to different concentrations of 3-NP, an inhibitor of mitochondrial complex II. D, ATP levels per milligram of protein, neuronal survival, and AD2+ cell bodies in cultures after exposure (6 h for ATP, 48 h for survival and AD2) to different concentrations of CCCP, an uncoupler of oxidative phosphorylation. Scale bars, 20 μm.