
Figure 2.
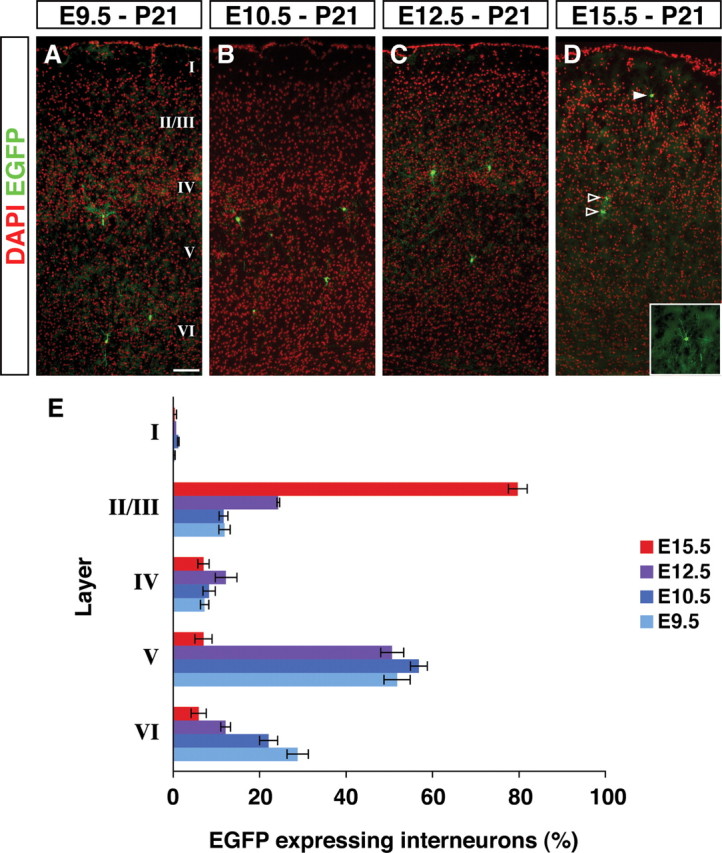
Early and late fate-mapped cortical interneurons follow an inside-out layering pattern. Layering of the fate-mapped cortical interneurons within the P21 somatosensory barrel field was analyzed. A–D, Representative examples of sections are shown from tamoxifen administration at E9.5 (A), E10.5 (B), E12.5 (C), and E15.5 (D). Analysis has been done based on the cortical layers shown by DAPI nuclear staining (pseudocolored in red) and EGFP immunostaining (green). Cells with interneuron morphologies (D, filled arrowhead and inset) were analyzed for their molecular expression and physiological character, but the glial cells (D, open arrowheads) were not considered further in our analysis. E, The layer distribution of cortical interneurons fate mapped from each embryonic time point were analyzed. Fate-mapped interneurons followed an early-deep and late-superficial trend. Error bars indicate SE. Scale bar, 100 μm.