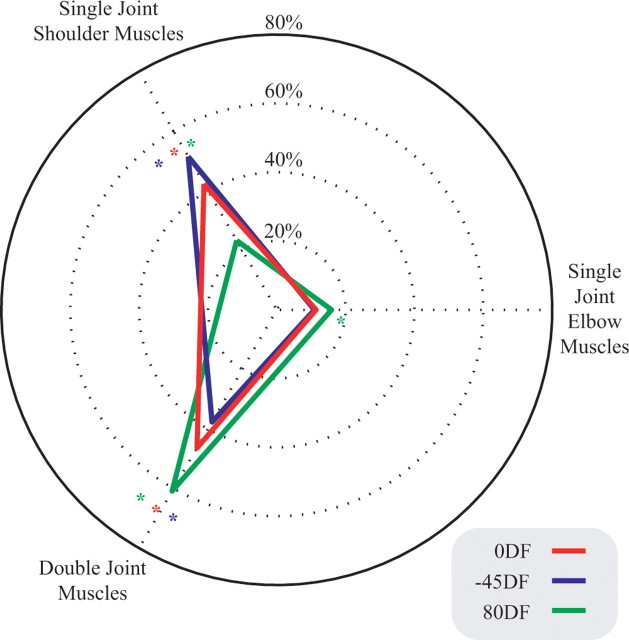
Figure 8.
Unique changes in EMG during movements in each of the three unstable force fields. For each force field, the increase in muscle pair activity relative to NF activity has been plotted as a percentage such that the total change in activity for the three muscle pairs sums to 100%. For each muscle pair, a significant difference for a given force field compared with the other force fields, as determined using post hoc analysis (Tukey's HSD), is indicated in the corresponding color (*p < 0.05). The figure shows the average values for the five subjects.

