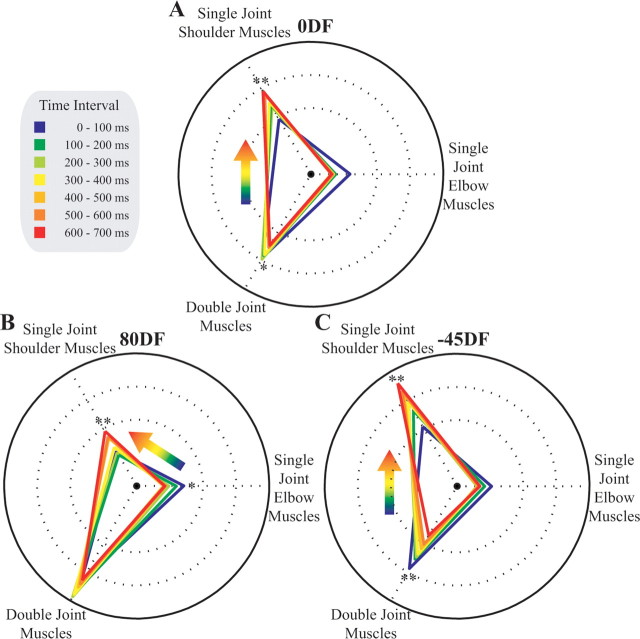
Figure 9.
The relative increase in EMG changes during movement. A, Changes in muscle activity over time in the 0DF. The relative change in the muscle activity is shown for each 100 ms time interval during the movement. As the hand moved away from the body, the difference in biarticular muscle activity decreased, and that of single-joint shoulder muscle activation increased, relative to NF activity. This can be seen as a smooth transformation in the location and shape of the triangle representing the relative muscle contributions. B, Changes in muscle activity over time in the 80DF. C, Changes in muscle activity over time in the 45DF. Both showed similar patterns to changes in the 0DF. Significant differences in the relative EMG activity for the shoulder, elbow, or biarticular muscles throughout the movement were tested with an ANCOVA with interval as the covariate. Significant main effects of the covariate are indicated (*p < 0.05; **p < 0.001). Under conditions in which one muscle group significantly decreased its relative activity over the interval while another muscle group increased its relative activity, this change is shown with the colored arrow. The figure shows the average results across all five subjects.

