
Figure 1.
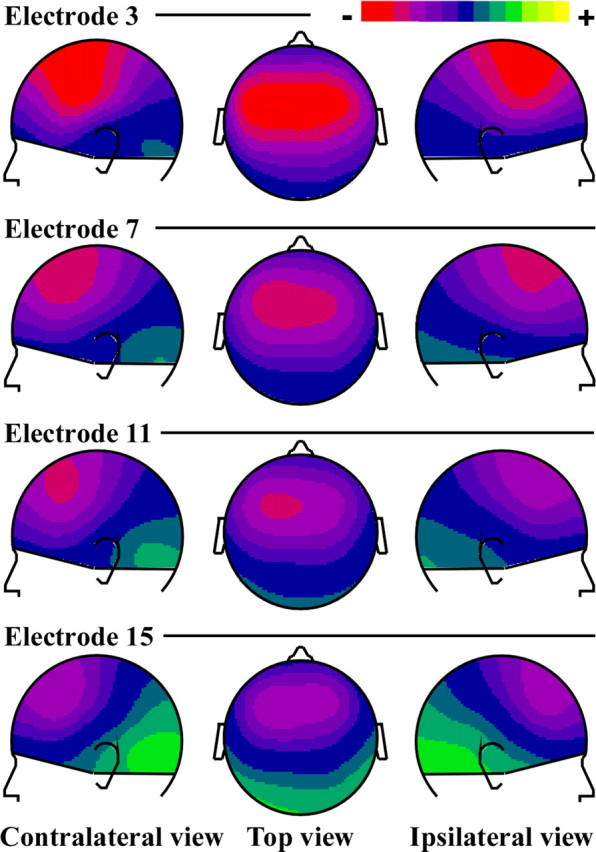
Scalp potential distributions of the grand-averaged auditory N1 responses to stimulation at four implant electrode sites (top line, activation of the apical part of the electrode array; bottom line, activation of the basal part of the electrode array). The maps are drawn at the latency of the maximum amplitude at Fz (85.5 ms). The topographies are characterized by negative potential fields over frontocentral scalp areas, and positive potentials around the temporal mastoid sites, typical of activities in the auditory cortex. The color scale is ± 2.3 μV. White dots indicate the sites of EEG recording.