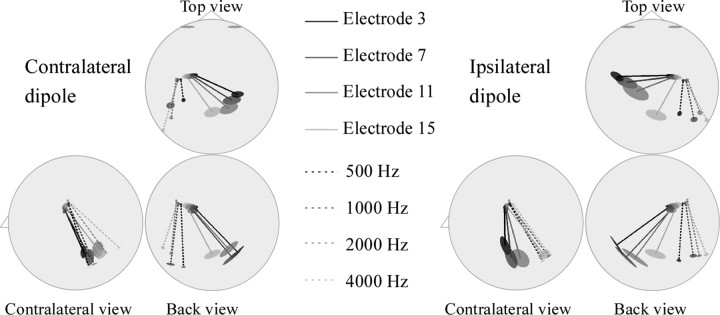
Figure 4.
Top, back, and lateral two-dimensional views of stationary dipole solution modeling of the auditory N1 response to electrical pulses at four stimulation electrodes in cochlear implant users and to four pure tones (500, 1000, 2000, and 4000 Hz) in normal-hearing subjects [data from Verkindt et al. (1995)]. Ninety-five percent confidence interval ellipsoids are drawn around the projections of the dipole positions and orientations.

