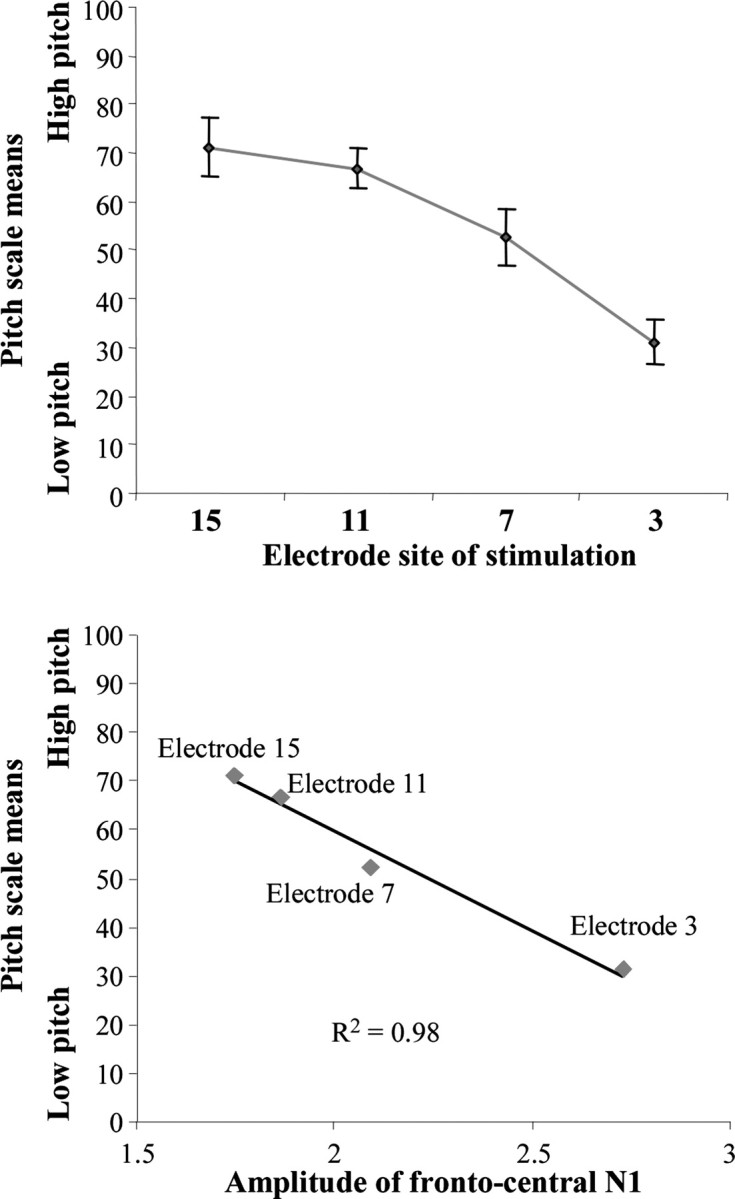
Figure 5.

Top, Grand-averaged data for the pitch scaling task. Stimulation electrodes are plotted along the abscissa. Vertical bars indicate the SE around each mean. Bottom, Scatterplots show the relationship between the mean values of the pitch scale test and the grand-averaged measures of the maximal frontocentral N1 amplitude for electrodes 3, 7, 11, and 15.
