Figure 2.
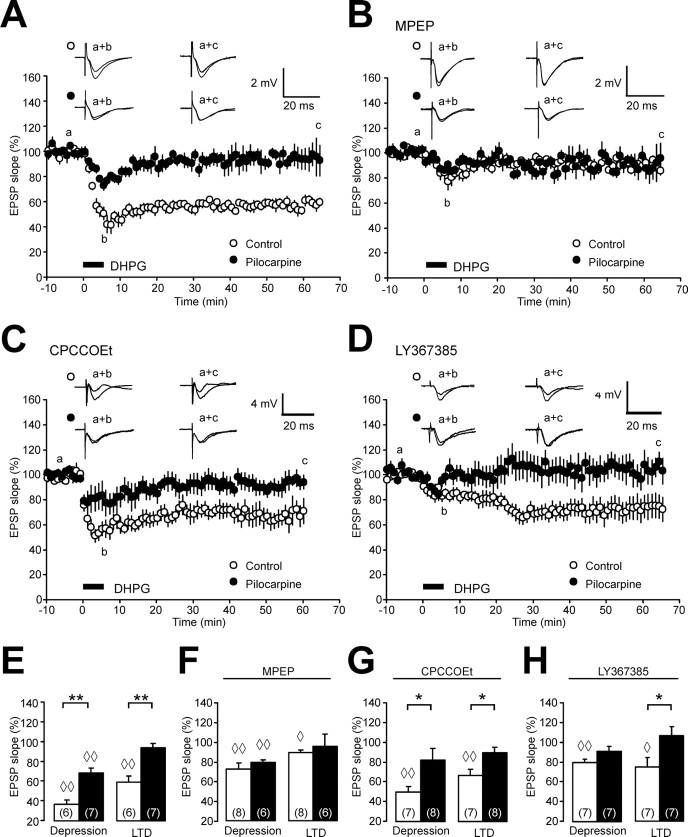
mGluR LTD is impaired after status epilepticus. A, The time course of CA1 field EPSP slopes after brief application of DHPG (100 μm, 5 min) shows a significant difference between controls (open circles) and pilocarpine-treated rats (closed circles). Representative field EPSPs (average of two subsequent traces) are taken at the time-points indicated by lowercase letters. B, The time course of CA1 field EPSP slopes after brief application of DHPG (100 μm, 5 min) in the presence of the mGluR5 blocker MPEP (10 μm) no longer shows a difference between controls (open circles) and pilocarpine-treated rats (closed circles). C, D, The time course of CA1 field EPSP slopes after brief application of DHPG (100 μm, 5 min) in the presence of the mGluR1 blockers CPCCOEt (10 μm; C) or LY367385 (100 μm; D) reveals a difference between controls (open circles) and pilocarpine-treated rats (closed circles). E–H, Bar graphs showing the DHPG-induced acute depression and LTD levels without mGluR antagonists (E), and with preincubation of the mGluR antagonists MPEP (F), CPCCOEt (G), or LY367385 (H). Diamonds in E–H (◇p < 0.05; ◇◇p < 0.01) indicate significant differences compared with pre-DHPG baseline. Other significant changes are indicated by asterisks (*p < 0.05; **p < 0.01). Error bars indicate SEM.

