
Figure 4.
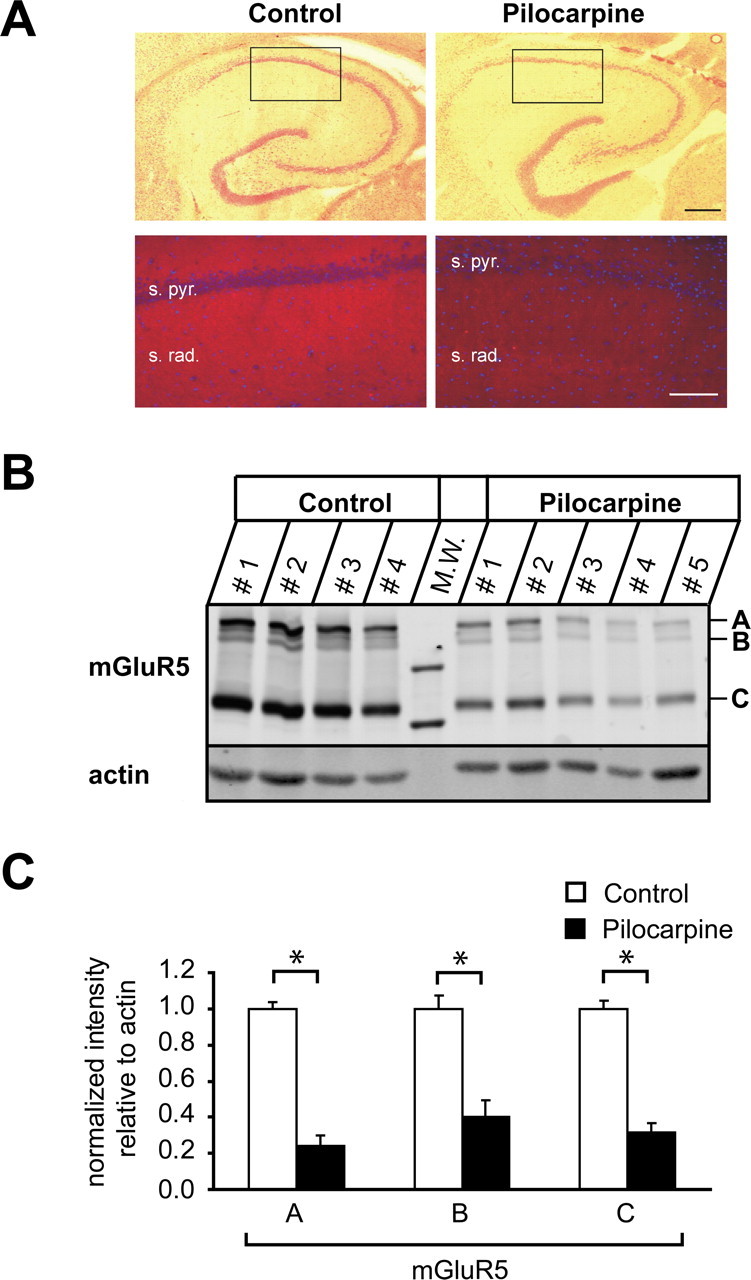
mGluR5 protein is decreased after status epilepticus. A, Hippocampal sections of control (left) and pilocarpine-treated (right) animals were stained with HE or probed with an antibody against mGluR5 (red). s. pyr., Stratum pyramidale; s. rad., stratum radiatum. Nuclei (blue) were labeled with DAPI. Scale bars: top, 400 μm; bottom, 10 μm. B, mGluR5 membrane fractions isolated from microdissected CA1 subregions. Fractions (see Materials and Methods) were analyzed by SDS-PAGE and immunoblotting with antibodies to mGluR5 and actin as indicated. The mGluR5 antibody recognized three specific bands: one corresponding to mGluR5 monomers at an apparent molecular mass of ∼130 kDa and two weaker bands of higher molecular weight, between 260 and 290 kDa, representing mGluR5 dimers (indicated by C, B, and A, respectively). CA1 tissue collected from one animal was loaded per lane. n = 4 and 5 for control and pilocarpine-treated animals, respectively. M.W., Molecular weight marker. C, Relative abundance of the three mGluR5 complexes. Proteins were quantified with the Odyssey imaging system. mGluR5 protein levels were normalized to actin protein levels for each lane and expressed as mean ± SEM (n = 4). Significant reductions are indicated by asterisks.