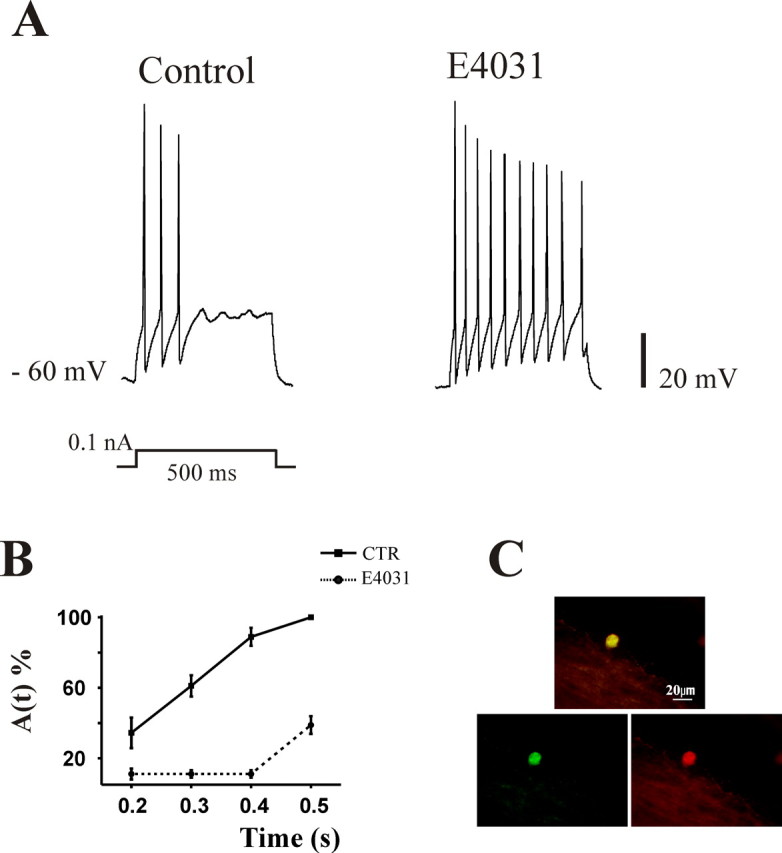
Figure 2.

Effects of E4031 on adapting cells at 7 DIV. A, Current-clamp recordings of an adapting interneuron in control solution (left trace) and after 10 min application of 1 μm E4031 (right trace). Note the removal of adaptation by pharmacological block of IK(ERG). B, The plot summarizes percentage changes in adaptation quantified as A(T) in control (CTR, filled square) and in the presence of E4031 (filled circles). Data are pooled from 12 cells. Note the presence of strong adaptation in CTR neurons that was significantly removed by the application of E4031. C, Example of positive double-staining of a recorded adapting cell for neurobiotin (green) and GABA (red) and their merged image (top). The same cell as in A is shown.
