
Figure 2.
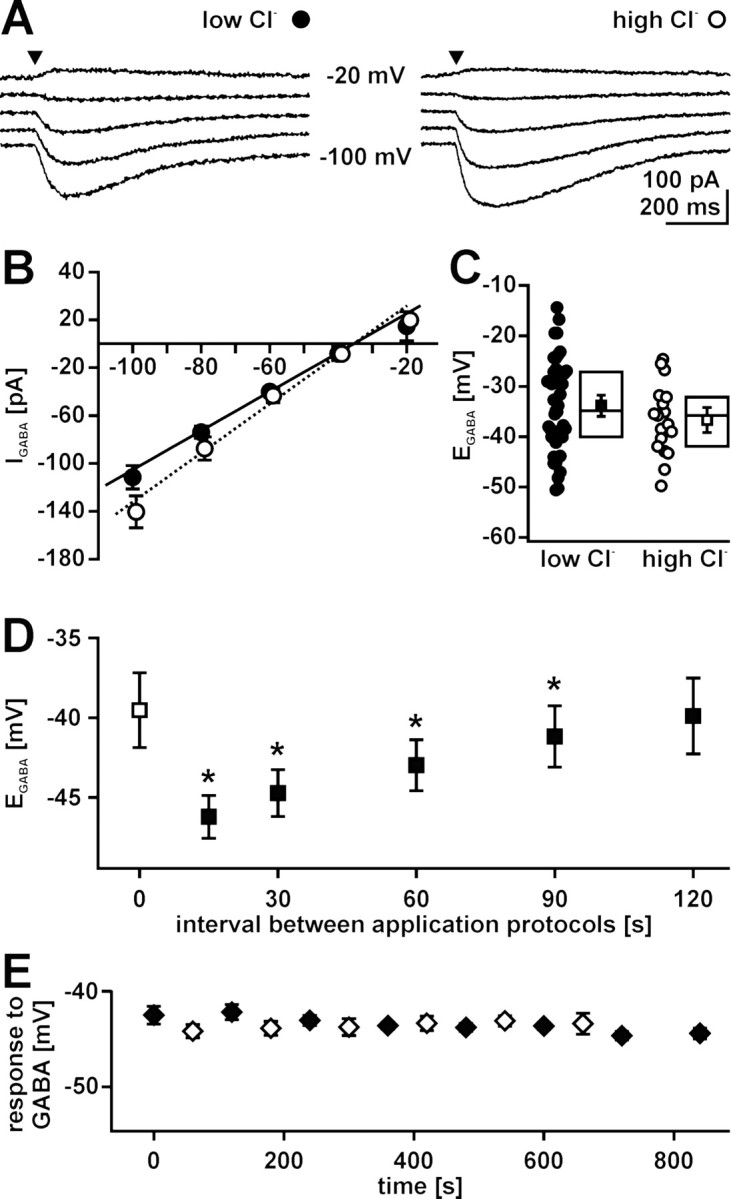
Methodical consideration for [Cl−]i determination in gramicidin-perforated patch-clamp experiments. A, Typical GABA-evoked currents of P1 CR cells recorded in gramicidin-perforated patch-clamp configuration using two different pipette solutions containing either 6 mm Cl− (low-Cl−; left) or 136 mm Cl− (high-Cl−; right). GABA was applied focally (arrowhead) while holding potential (Vh) was adjusted between −100 and −20 mV in 20 mV steps. B, Current–voltage relationship of GABAergic currents (IGABA) recorded with low-Cl− (closed circles) and high-Cl− (open circles) pipette solution under gramicidin-perforated patch-clamp conditions. Data points represent means ± SEM of at least 18 experiments. The intersection of the linear fit and the x-axis indicates EGABA. C, Plot of EGABA obtained in all experiments using low-Cl− (closed circles) and high-Cl− (open circles) pipette solution under gramicidin-perforated patch-clamp conditions. Statistical analysis revealed that EGABA was identical using low Cl− (closed square) or high Cl− (open square) pipette solution. Box plots displaying median, top, and bottom quartile suggest a normal distribution of the data. D, Relationship between intervals of GABA application sequences and EGABA. EGABA was determined by the protocol shown in A at intervals between 15 and 120 s. Closed squares represent mean ± SEM of five experiments; the open square represents EGABA determined by the first application sequence. Note that EGABA was significantly (*p < 0.05; Wilcoxon test) reduced if the interval between application protocols is <120 s. E, Determination of EGABA (closed diamonds; n = 6) and GABA-induced peak depolarization (open diamonds; n = 4) with an interval of 2 min between application sequences performed at holding potentials of −60 mV. Both GABA responses were stable over the whole observation period.