Figure 6.
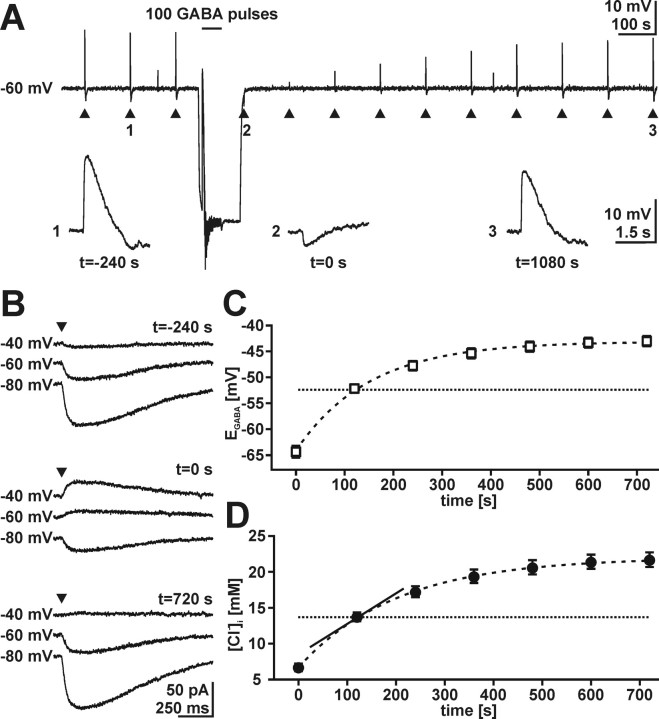
Cl− accumulation in CR cells recorded under gramicidin-perforated patch-clamp conditions. A, Depletion protocol recorded in slow voltage-clamp mode. Arrowheads mark the focal application of a single GABA pulse. GABA pulses identified by numbers are displayed below the trace. Application of 100 GABA pulses at −100 mV reversed the direction of GABA responses recorded at −60 mV. The complete recovery process of GABAergic responses takes 18–20 min. The negative potential shifts after a GABA pulse were artifacts resulting from the slow voltage-clamp system. B, Voltage-clamp recordings of the typical protocol used to determine EGABA before (t = −240 s), directly after depletion (t = 0 s), and after recovery of [Cl−]i (t = 720 s). C, Recovery process of EGABA after depletion protocol. Data points represent mean ± SEM of 26 experiments. The recovery process was slow, taking 10–15 min. The dashed line indicates EGABA of −52.4 mV, which corresponds to passive Cl− distribution at −60 mV, considering a HCO3−/Cl− conductance of 0.2. D, Recovery of [Cl−]i as calculated from the values shown in C. The dashed line indicates passive Cl− distribution. The slope of the tangent (solid line) in this point is used to estimate the velocity of Cl− accumulation (see Results for details).

