Figure 7.
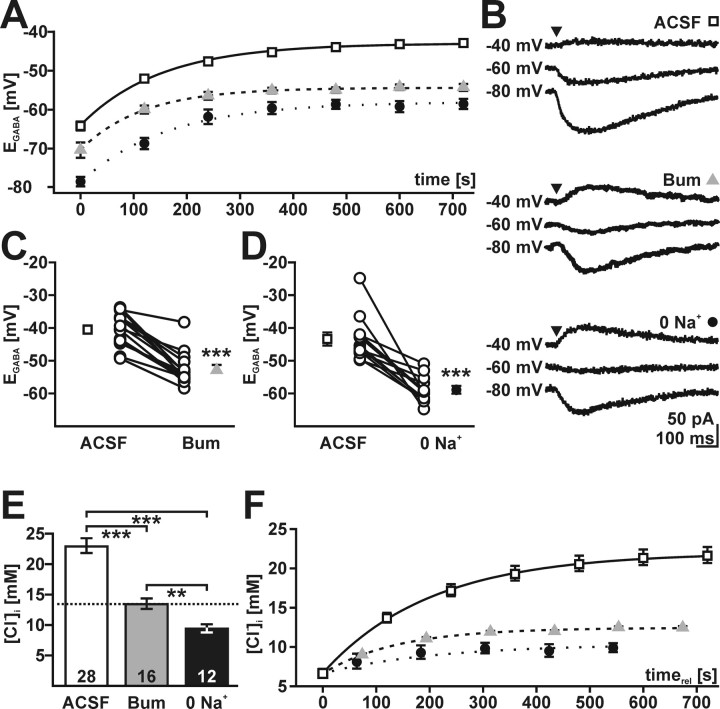
Pharmacology of Cl− accumulation. A, Recovery process of EGABA after depletion protocol under control conditions (open squares; n = 26), in Na+-free ACSF (filled circles; n = 7) and in the presence of 50 μm bumetanide (gray triangles; n = 10). The recovery process and final EGABA were altered by bumetanide and Na+-free ACSF. B, Typical responses to GABA application protocols used to determine EGABA after recovery in ACSF, 50 μm bumetanide (Bum), and Na+-free ACSF (0 Na+). C, Plot of EGABA determined after recovery in ACSF and subsequent recovery in 50 μm bumetanide. Individual experiments are shown as open circles connected by lines (mean ± SEM was calculated from 16 experiments). D, Plot of EGABA after recovery in ACSF and Na+-free ASCF. Mean ± SEM was calculated from 12 experiments. EGABA after recovery was significantly reduced (p < 0.001) by bumetanide and Na+-free ASCF. E, Effect of bumetanide and Na+-free conditions on [Cl−]i. Error bars represent mean ± SEM of [Cl−]i as calculated from EGABA shown in C and D. The number of experiments is shown in the bars, and the dashed line indicates passive Cl− distribution. F, Recovery of [Cl−]i calculated from the values depicted in A. Recovery curves are aligned to a [Cl−]i of 6.6 mm (for details, see Results).

