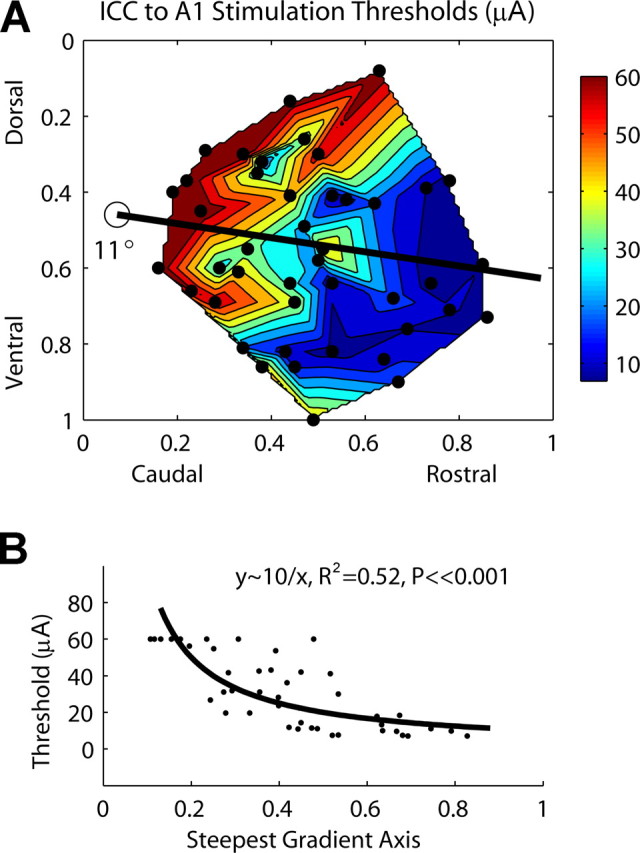
Figure 6.

A, Contour plot of ICC stimulation thresholds as a function of location along the ICC laminas. The dots correspond to each of the 44 stimulation sites. For thresholds greater than our maximum level of 56.2 μA, we set them equal to 60 μA for better visualization of the gradient. B, Thresholds as a function of stimulation location along the steepest gradient axis from A (black line), which is aligned 11° off the caudorostral direction. Zero (0) (along abscissa) corresponds to the location of the open circle in A.
