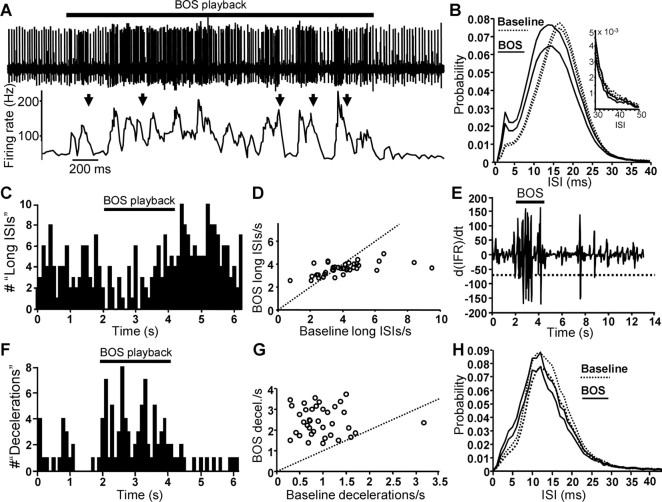
Figure 6.
HF units exhibit rapid rate fluctuations during song playback. A, Example of HF unit activity during a single trial of BOS playback. The spike rate function below the raw trace illustrates the phasic increases and decreases in rates typical of HF units. Arrows indicate epochs of rapid rate deceleration. B, Probability distribution of ISIs during baseline (dotted line) and BOS (solid line) for all HF units. Each pair of lines represents mean and mean + 1 SD. Inset, Right-hand tail of ISI probability distribution, demonstrating no difference in relative frequency of long intervals. C, An example of occurrences of long ISIs over multiple trials of BOS playback, defined as those ISIs above the 95th percentile of ISIs. D, Population summary of the rate of occurrence (occurrences per second) of long ISIs between BOS and baseline epochs. Each circle represents an HF cell. E, An example of the derivative of a smoothed instantaneous firing rate (IFR) function (d(IFR)/dt) plotted against time. The dashed line indicates the fifth percentile used as a cutoff for defining rapid decelerations. F, An example of the occurrence of decelerations in an example HF cell across multiple trials of BOS playback (same cell as in C). The times of the 5% most extreme rate drops were measured with respect to song. Rate decelerations consistently occurred more frequently during BOS playback. G, Population summary of the rate (occurrences per second) of rapid decelerations during baseline periods is plotted against the number of rapid decelerations observed during BOS playback for each HF unit. Most units fall above the unity line, indicating more frequent decelerations during BOS playback than during baseline periods. H, ISI probability distribution for HF units (n = 11) that were paired with LF neurons (Fig. 7) during baseline and BOS-playback epochs. Line conventions are the same as in B.

