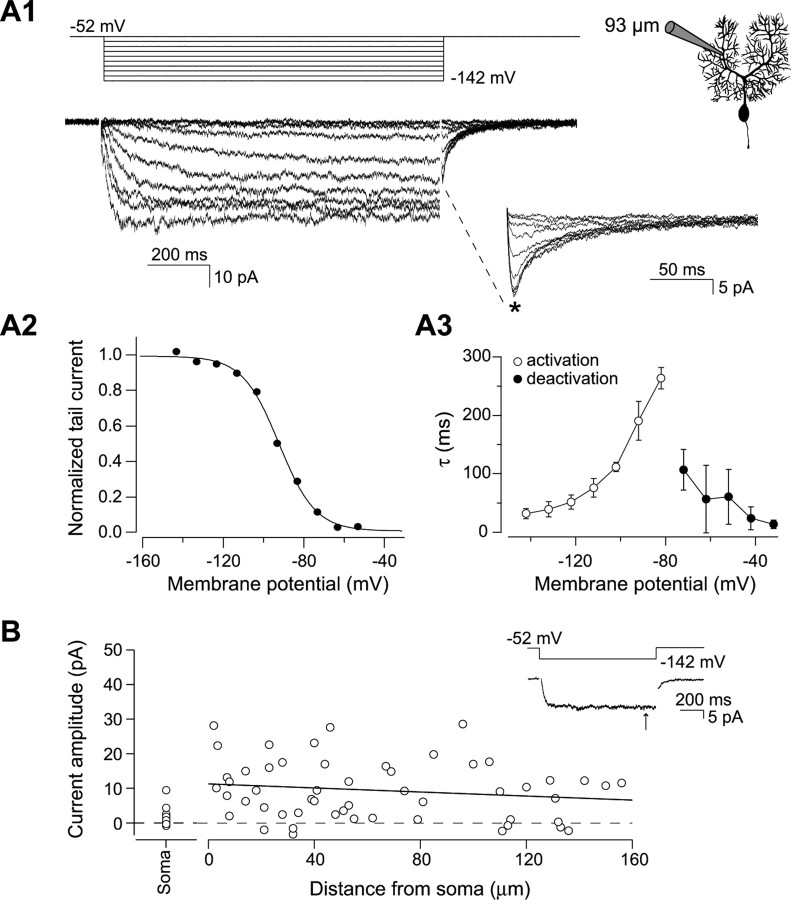
Figure 1.
Properties and distribution of Ih in Purkinje cells. A1, Ih recorded in a dendritic cell-attached patch-clamp recording 93 μm from the soma. The patch was held at −52 mV and hyperpolarized for 1 s in steps of 10 mV from −52 to −142 mV. Tail currents evoked by stepping back to −52 mV for 200 ms are expanded. A2, Activation curve of the Ih current in A1. The peak tail currents (*) are normalized to the top plateau of a Boltzmann function. The solid line represents a sigmoidal fit to the data points giving a midpoint of activation at −91.1 mV with a slope constant of −9.1 mV (sigmoidal fit to the mean ± SEM of 5 recordings: V1/2 = −90.3 mV, slope constant = −9.7 mV). A3, Time constants of Ih activation and deactivation. The time constants were obtained by fitting single exponentials to traces in which the Ih current is activated from the closed state or deactivated from a maximally open state at potentials between −142 and −82 mV (open) and between −72 and −52 mV (filled), respectively (n = 5). B, Distribution of Ih along the soma–dendritic axis. The steady-state Ih amplitudes from full activation of the current at −142 mV (inset, arrow) are plotted as a function of distance from the soma (n = 53 cell-attached patches). A straight line with a slope of −3 pA/100 μm is fitted to the data points.

