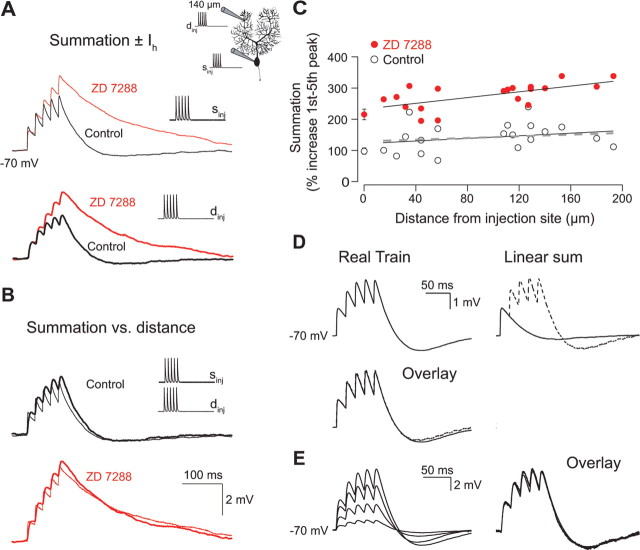
Figure 3.
Effect of Ih on summation of sEPSPs. A, Representative somatic sEPSP traces from injection of five EPSC-like waveforms at a frequency of 50 Hz in the presence and absence of ZD 7288. The control and ZD 7288 traces from the same recording are overlaid according to injection site (somatic or dendritic). The thin and thick lines represent responses to somatic and dendritic current injections, respectively. This comparison directly shows the effect of Ih on summation for the two injection sites. B, The somatic voltage response from a dendritic injection at 140 μm from the soma was scaled to peak of and superimposed on the voltage response from a somatic injection. Note the small effect of distance on summation both in control and in ZD 7288. C, Pooled data from experiments performed according to the experiment in A. The dendritic pipette was positioned at different locations on the dendritic tree up to a maximum of 190 μm from the soma. The summation recorded with the somatic pipette is plotted as a function of distance from the injection site. The open and red markers represent control and ZD 7288 data points, respectively. A straight line has been fitted to each dataset for the dendritic inputs. The data points at the soma represent the mean ± SEM of 15–17 recordings including three to four double somatic experiments. Values of summation were calculated from the control sEPSPs in Figure 2D assuming linear summation. The dashed line on the plot represents the result of linear regression to the predicted data. D, Linearity of sEPSP summation. Somatic voltage trace from somatic injection of five consecutive waveforms at 50 Hz (real train). The response to an individual EPSC waveform injection was recorded from the same cell and the linear sum of five single sEPSPs was subsequently calculated (---). The overlay demonstrates that the linear sum matches the recorded train. E, Scaling of summation. Superimposed somatic responses to sEPSP trains with first EPSC amplitudes of 0.2, 0.6, 1.0, and 1.4 nA. Scaling the 0.2 nA injection to the 1.4 nA injection shows the amplitude independence of the temporal summation.

