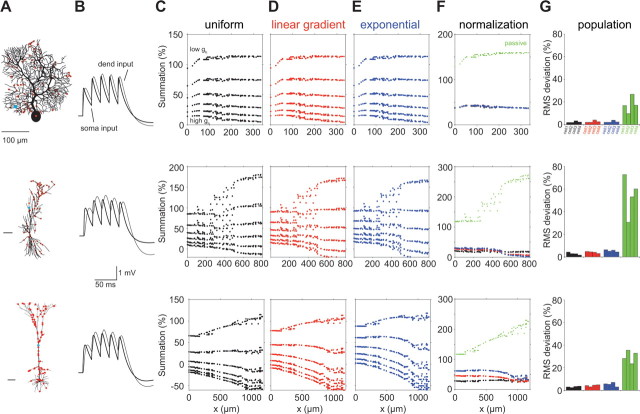
Figure 4.
The effect of Ih spatial distribution and density on temporal summation in models of dendritic neurons with realistic morphology. Three dendritic morphologies: cerebellar Purkinje cell (top row), CA1 pyramidal (middle row), and cortical layer 5 pyramidal neurons (bottom row) were modeled with uniform (C), linear gradient (D), and exponential (E) distributions of gh conductance (see Materials and Methods). Scale bar, 100 μm. For each cell type, we started with gh = 0.00005 S/cm2 and repeated the simulation 12 times (only 6 densities are depicted), each time gradually increasing the density by 0.00003 S/cm2 (C, top: low density to high density). For each of the neurons and each of the profiles of spatial distributions, there exists a density that results in location-independent temporal summation. B compares the voltage response at the soma for a somatic and dendritic current injection (cyan spots in A) for case of a uniform distribution shown in F. F shows the temporal summation for the Ih density for which the uniform distribution shows the best location independence of temporal summation (black). Also depicted are the summation for the linear gradient (red) and the exponential (blue) with the same average gh and the case in which Ih is absent (passive; green). In G, we quantify the degree of normalization for 12 neurons (4 of each type). For each distribution, we pick the optimal density for normalization and plot the SD of the summation (expressed as root mean square deviation) for this case. Colors are as in other panels.

