
Figure 3.
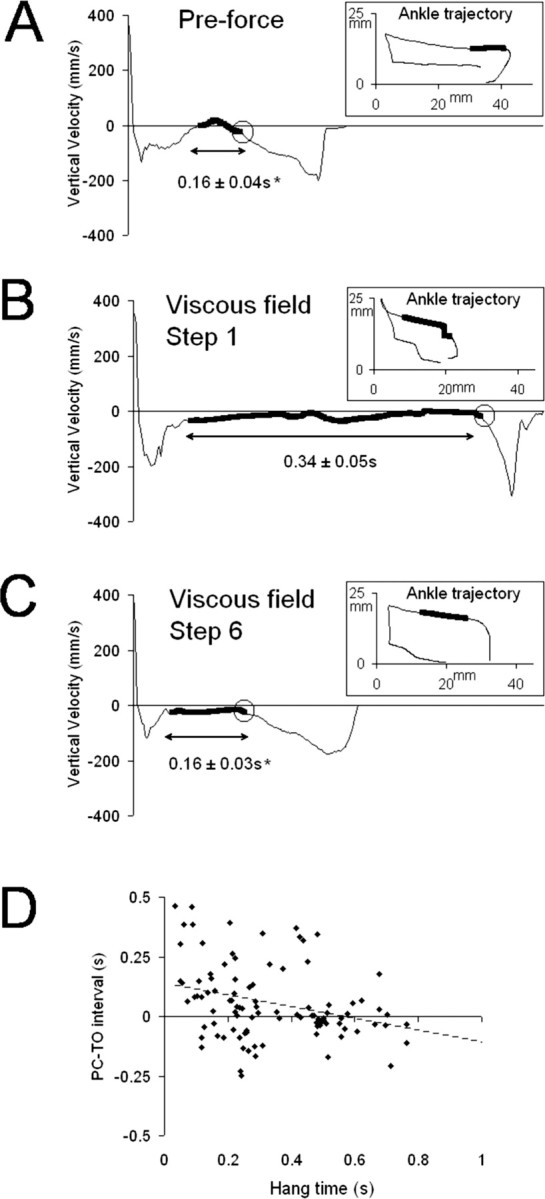
Relationship between hang time in the perturbed limb and PC–TO interval. A, Plot of the vertical velocity over time from a single step cycle recorded during preforce testing. B, Plot of the vertical velocity over time recorded during the first perturbed step. C, Plot of the vertical velocity over time recorded during the sixth perturbed step. The data shown are from one representative ST rat. The insets show the corresponding ankle trajectory. The thick black line indicates hang time. Circles in the velocity plots indicate the beginning of downward movement in the hindpaw before PC. The mean hang times ± SE are shown below the velocity plots (n = 10). The asterisk indicates a significant difference with the mean hang time for the viscous field, Step 1 condition (p ≤ 0.01). D, Plot of the PC–TO interval versus hang time in the perturbed hindlimb. Data shown are from all of the perturbed steps in all ST rats (10 steps for each rat; n = 10 rats). The Pearson correlation (coefficient, −0.328) was significant at the level of p < 0.01.