
Figure 5.
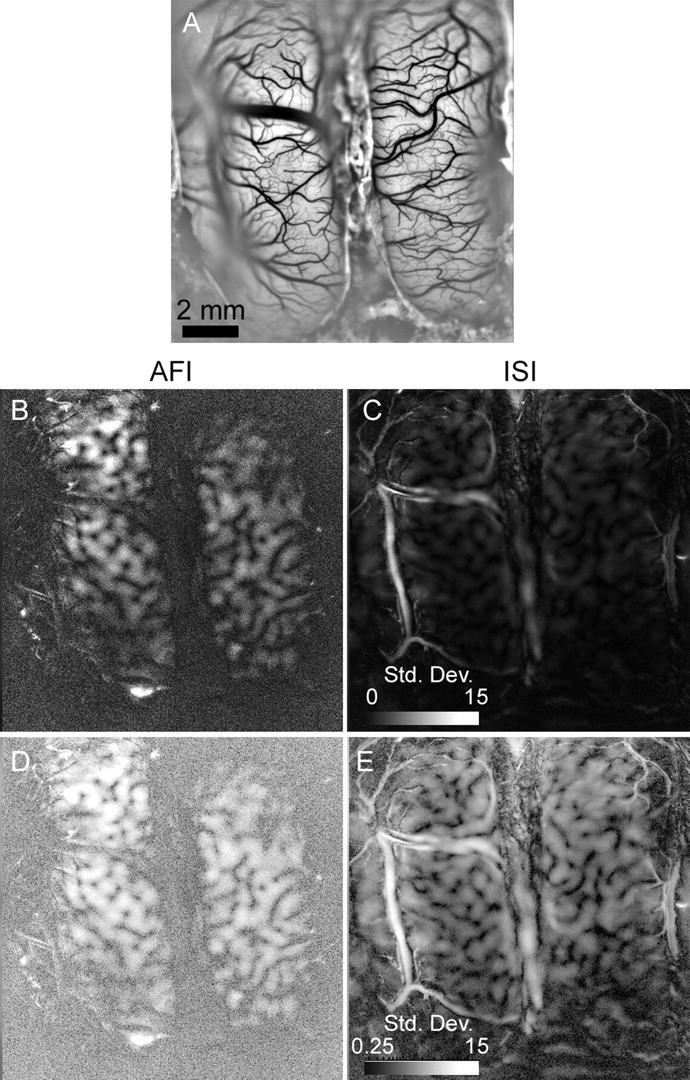
Vascular artifacts in ISI and AFI functional maps. A, The vascular pattern of the imaged field (same field as Fig. 2). The image was high-pass filtered and contrast stretched to better visualize blood vessels. B, The SD of fluorescent light intensity in AFI images generated in response to four oriented square-wave gratings. The brighter a pixel, the greater is its SD in response to the stimuli. The scale bar shows the range of SDs in blank-normalized images, multiplied by 10,000; the scale bar is applicable to B and C. C, The SD of reflected light intensity in intrinsic signal images generated in response to four oriented square-wave gratings. D, The same image as in B, but SDs have been log-scaled for better visualization. E, The same image as in C, but log-scaled. The scale bar is applicable to both D and E.