
Figure 9.
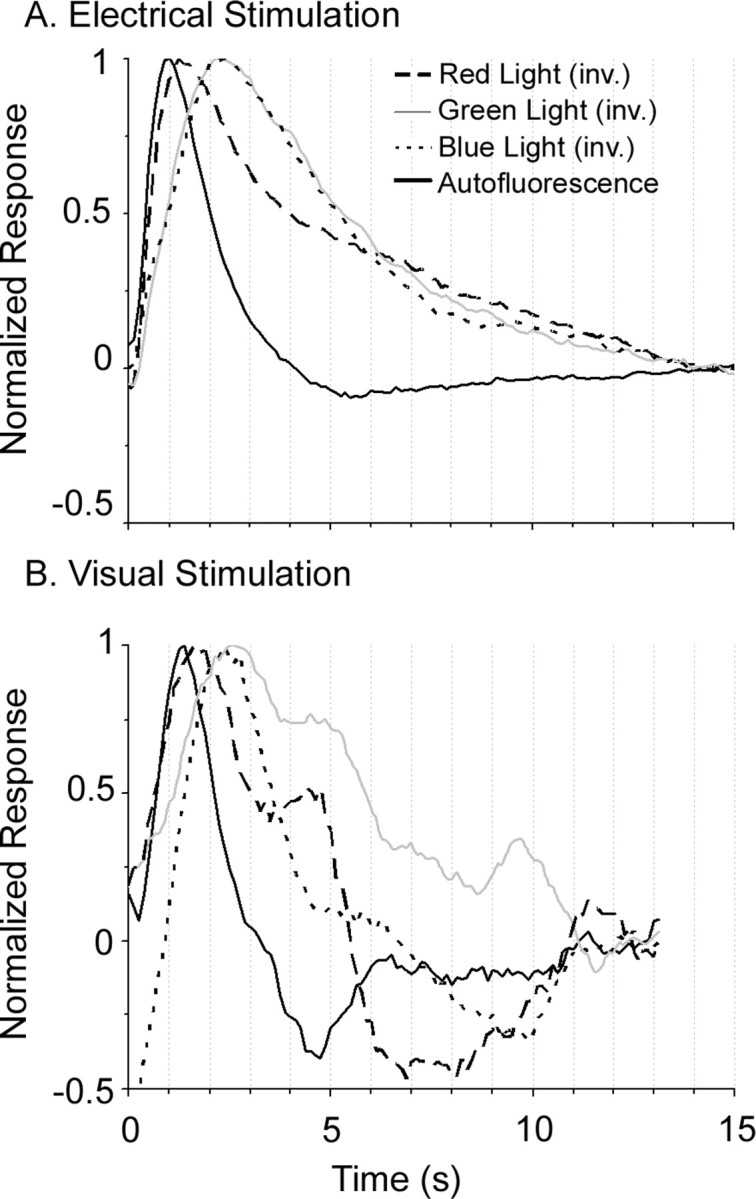
Visually and electrically driven AFI and absorption signal profiles. A, B, Time courses for the autofluorescence signal and potential intrinsic signal contaminants (all of which were inverted for direct comparison) for electrical (A) and visual (B) stimulation. Each trace is the average response over a 3 × 3 pixel region and is averaged over 22 cycles of stimulation.