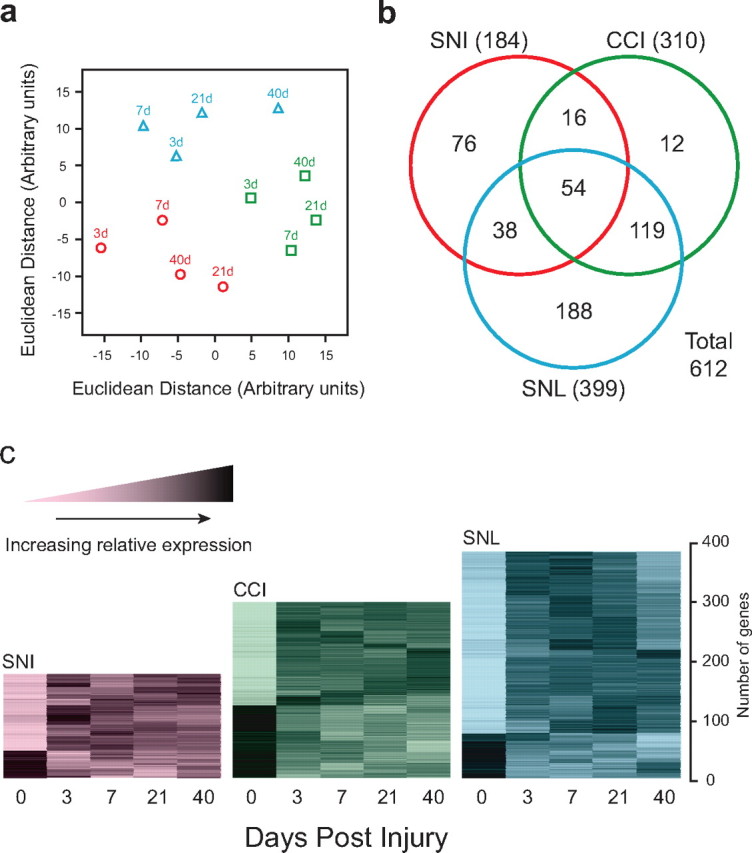
Figure 1.

Global expression profiles in neuropathic pain models. A, Multidimensional scaling display of the dissimilarities among the microarrays. Axes are in arbitrary units derived such that the distance between each pair of points in the XY plane is the most accurate possible representation of the Euclidean distance between the expression levels of all the genes measured on the corresponding pair of microarrays. SNI (red circles), CCI (green squares), and SNL (blue triangles) data are shown with time points as indicated. B, Venn diagram showing the number of regulated genes meeting fold difference and statistical thresholds in each model (SNI, CCI, or SNL). C, Temporal expression patterns of genes regulated in neuropathic pain models within the dorsal horn. Each gene was normalized according to mean 0, SD 1 and subjected to k-means clustering. The increased relative expression level is shown by increasing darkness.
