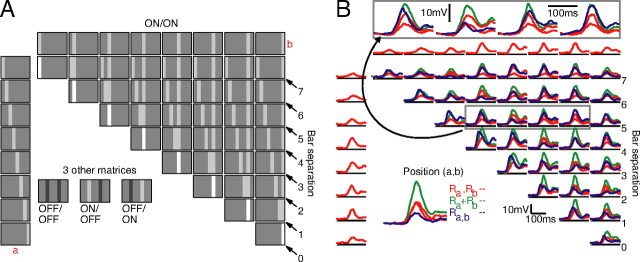
Figure 2.
Stimulus organization. A, Responses to all stimuli were arranged in matrices as depicted. Stimuli falling along the arrows contained bars that were equidistant from each other. The major diagonal stimuli (bar separation, 0) were at 90% contrast, mimicking the coincidence of two 45% contrast stimuli at the same spatial location; all other stimuli were at 45% contrast. Four variations of this stimulus arrangement were created for each cell: ON–ON (shown), ON–OFF, OFF–OFF, and OFF–ON. B, The full set of ON–ON responses for the complex cell from Figure 1. Responses to each bar presented individually at 45% contrast (Ra and Rb) are in red, the response to both bars together (Ra + b) is in blue, and the predicted response to both bars together (Ra + Rb) is in green. Along the main diagonal, the blue responses are identical to the gray traces in Figure 1C. The gray box contains traces that have been magnified for easier viewing (arrow).

