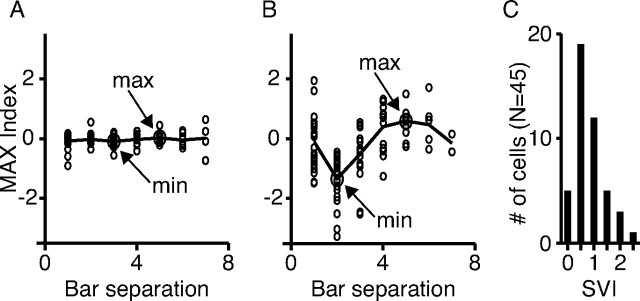
Figure 7.
Method for measuring complex cell spatial variation. A, Average MAX indices (composite MAX index) for cell M1. The SVI is derived by taking the largest composite MAX index and subtracting the smallest composite MAX index. B, Same as in A for the cell C3. C, Histogram of the SVI showing a continuum of MAX-like behavior over the population.

