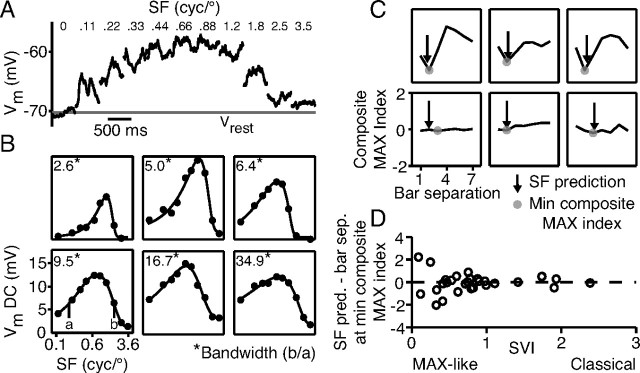
Figure 8.
Complex cell preferred spatial frequencies predict the distance of maximum paired-bar suppression. A, Cycle-averaged responses of a complex cell to drifting gratings of varied spatial frequency. B, Spatial-frequency tuning curves for six cells with similar preferred spatial frequencies; their bandwidths, however, varied considerably. The smooth curve is a least-squares fit to the data (closed circles). C, Plots of composite MAX indices for the cells in B and predictions of minimal composite MAX index (filled circles) from the preferred spatial frequency (vertical arrows). D, Difference between the location of the smallest composite MAX indices and the predictions based on spatial frequency plotted against SVI. The predictions are worse for MAX-like cells.

