
Figure 4.
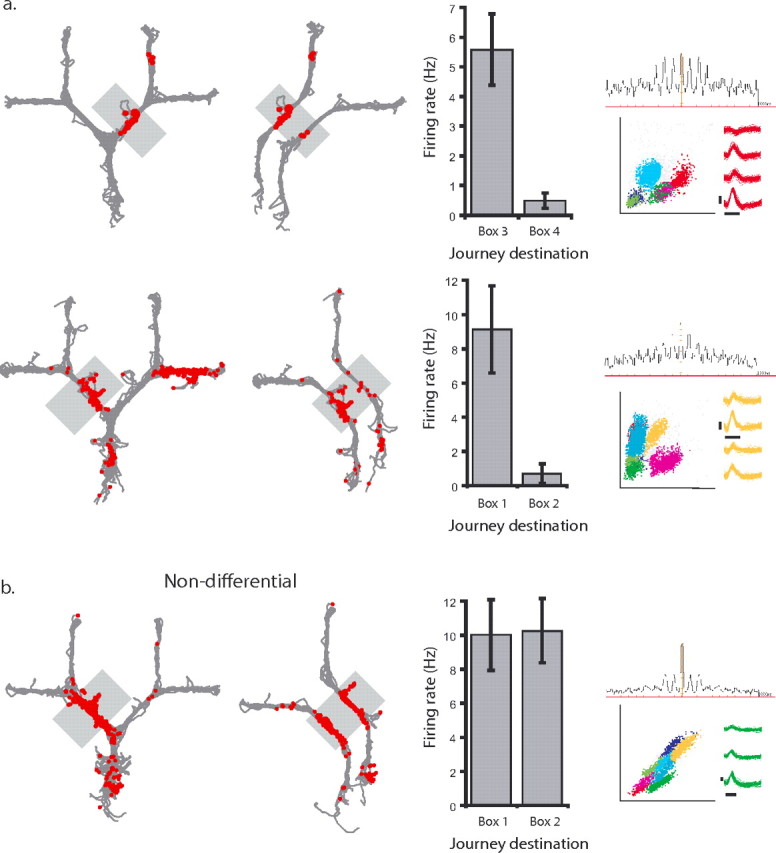
CA1 place cells before the final choice point encode intended destination. A, Two examples (1 on each row) of CA1 place cells with place fields before the final choice point that fired predominantly on trials to one of the two possible goals. The left column shows all of the trials from a single session, with the spikes from an individual neuron represented as red dots. The shaded gray box indicates the area of the maze with the place field of interest. The middle left column shows journeys to each goal box separately. The middle right column shows the average firing rate in the gray shaded area for journeys to the two possible goal boxes. The right column shows the cluster, waveforms, and autocorrelogram of the cell. Calibration: horizontal lines, 300 μs; vertical lines, 100 μV. B, An example of a cell that had similar firing rates on journeys to both goal boxes.