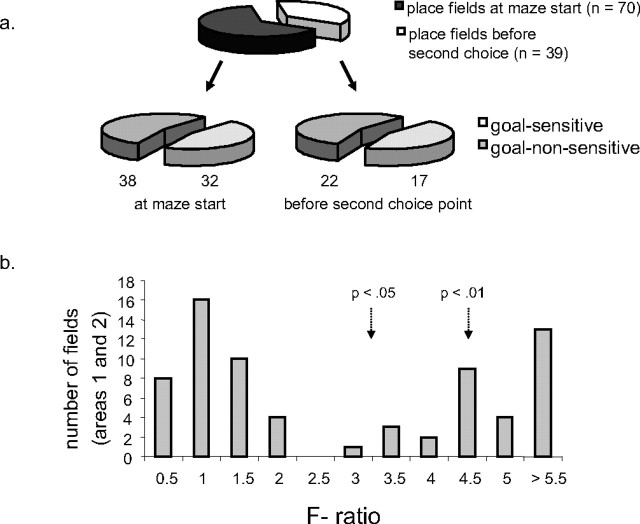
Figure 5.
A, Proportion of place fields in the start of the maze (areas 1 and 2) and after the start areas, but before the second choice point (top pie chart). These are broken down into the proportions of goal-sensitive and goal-nonsensitive cells in each of these two regions (bottom pie chart). B, Distribution of F ratios for goal-sensitive and goal-nonsensitive fields in the start box and first common stem of the maze (areas 1 and 2).

