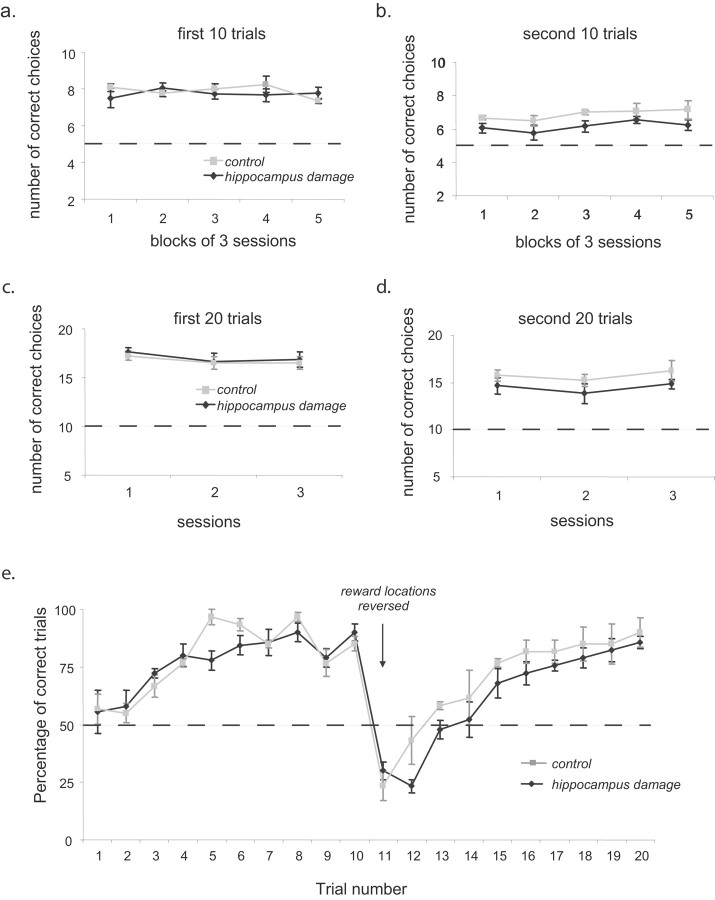
Figure 7.
Performance on the double Y-maze task. A, The mean ± SEM number of correct choices made by the hippocampal lesion and control group in the first 10 trials of each session (reward locations constant) in the 15 postsurgery sessions (for clarity, the data are presented in 3-session blocks). The dashed line indicates the chance performance level. B, The mean ± SEM number of correct choices made in the second 10 trials of the same sessions after the reversal in reward location in the same session blocks. C, The mean ± SEM number of correct choices made in the first 20 trials of each session (reward locations constant) by the hippocampal lesion and control group in the three 40-trial testing sessions. D, The mean ± SEM number of correct choices made in the second 20 trials of the same sessions after the reversal in reward location. E, Average performance of the hippocampal lesion and control groups on each trial. Each data point is the mean ± SEM percentage of correct choices for a given trial across the 15 postsurgery testing sessions.

