
Figure 4.
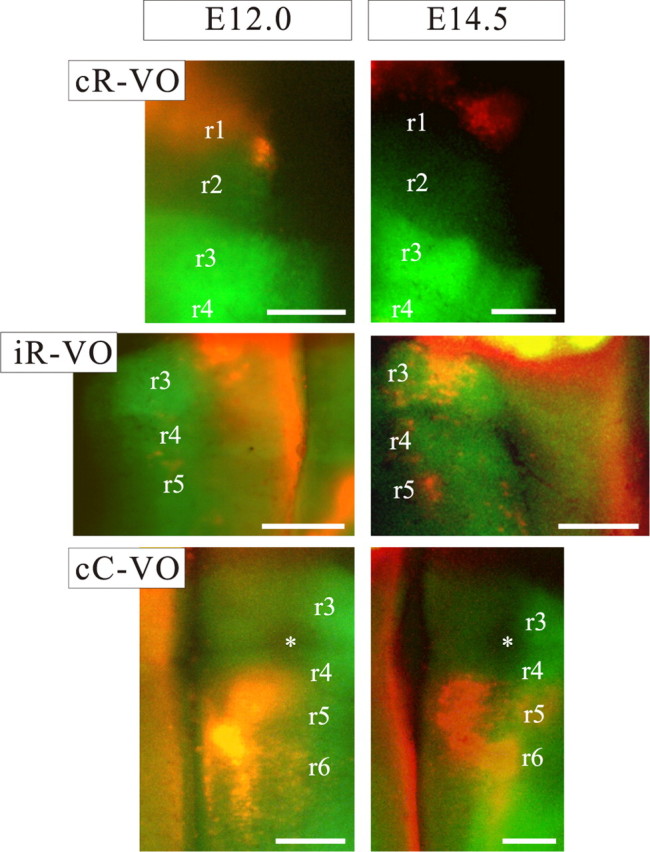
The relationship between rhombomeric territories (r1–r6) and the domains of the vestibulo-ocular groups at E12.0 and E14.5 as seen in whole-mount preparations of the Hoxa2EGFP mouse. Medial is to the left for the cR-VO and cC-VO groups and to the right for the iR-VO group. Some of the rhombomere boundaries can be seen clearly at these stages, independently of the EGFP expression pattern. Note that overlaps between the neuron groups and the EGFP expression domains can only be definitively assessed in sections (see Figs. 5–8). Asterisks mark the trigeminal nerve root, where EGFP expression is absent. Scale bars, 200 μm.