
Figure 6.
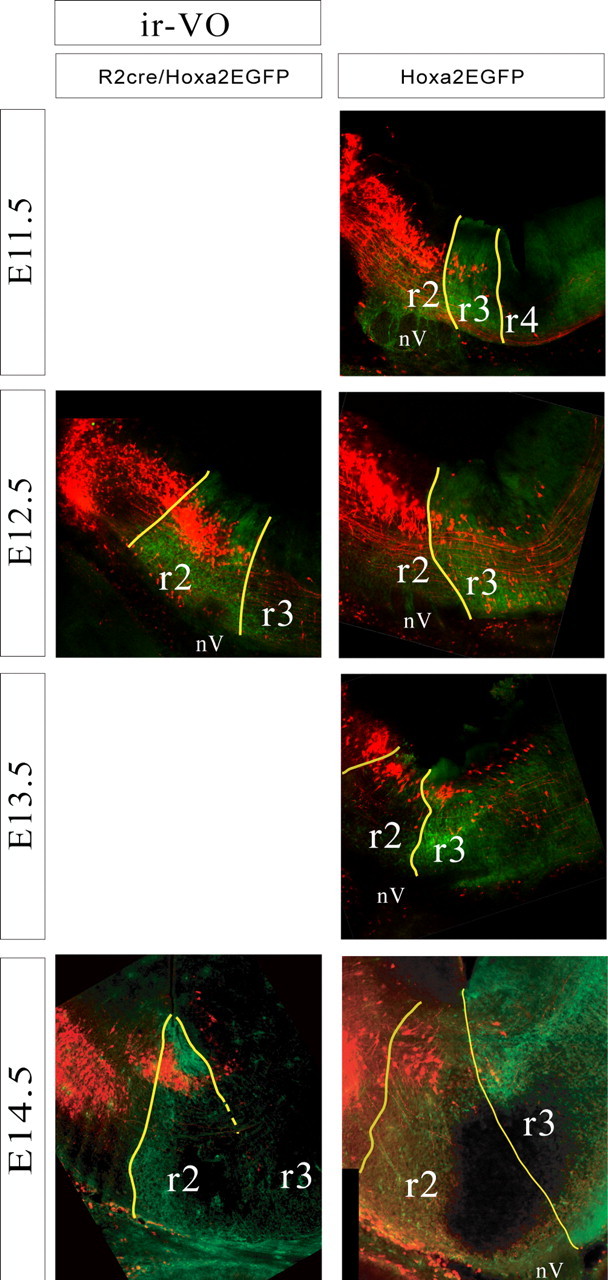
Relationship of the iR-VO group to rhombomere-derived domains as seen in parasagittal sections of r2::Cre;Hoxa2EGFP(lox–neo–lox) mice (left) and Hoxa2EGFP mice (right) at E11.5–E14.5. Yellow lines indicate expression domain boundaries that were clearly visible, and broken lines indicate less certain boundaries. Dorsal is up, and rostral is to the left. nV, Trigeminal nerve entry zone, which is devoid of EGFP expression.