
Figure 7.
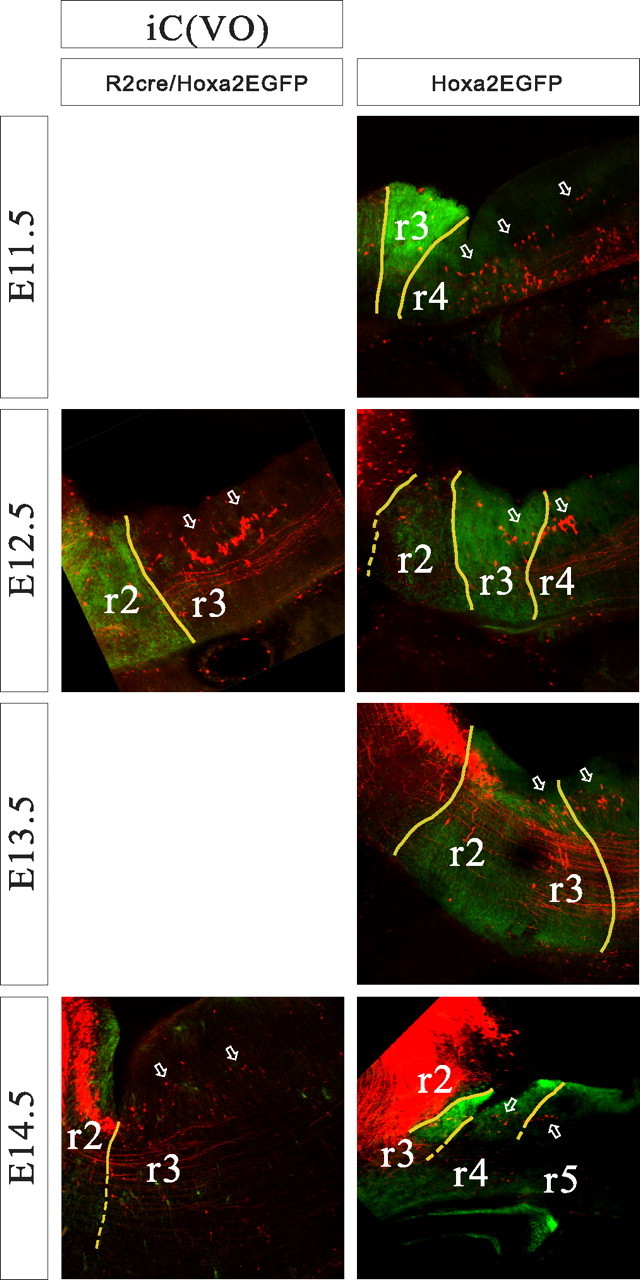
Relationship of the iC-VO group to rhombomere-derived domains as seen in parasagittal sections of r2::Cre;Hoxa2EGFP(lox–neo–lox) mice (left) and Hoxa2EGFP mice (right) at E11.5–E14.5. Arrows indicate the iC-VO neurons, which are few in number and dwindle markedly by E14.5. Yellow lines indicate expression domain boundaries that were clearly visible, and broken lines indicate less certain boundaries. Dorsal is up, and rostral is to the left.