Figure 1.

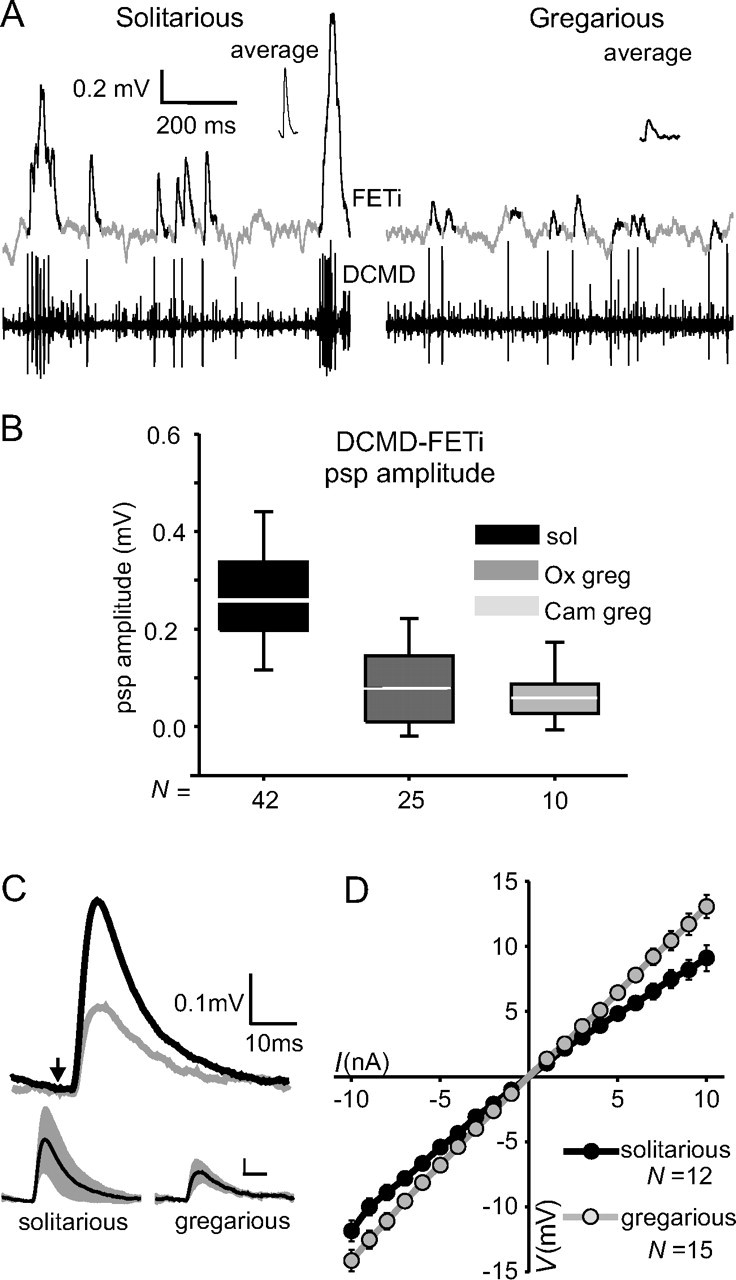
PSPs evoked by DCMD in FETi differ between locust phases. A, Recordings of DCMD and FETi in solitarious (left) and gregarious (right) locusts during stimulation by an object moving slowly across the visual field. DCMD-evoked PSPs in FETi are shown in black to distinguish them from background synaptic inputs. Averages of 50 PSPs in these recordings are shown as insets. B, Box plots showing medians (white line), 50% data range (boxes), and 90% data range (whiskers) for DCMD-evoked FETi PSP amplitudes for solitarious (sol) and two genetically distinct groups of gregarious locusts (Ox greg, Oxford gregarious; Cam greg, Cambridge gregarious). C, Average evoked PSPs in FETi from nine different solitarious (black) and nine different gregarious (gray) locusts. The small traces below show the SD (between locusts), with the scale bar at the same values as above. The arrow indicates the time of the triggering DCMD spike. D, Voltage response of FETi to current injections in the soma of gregarious (gray) and solitarious (black) locusts. Data are mean ± SEM.
