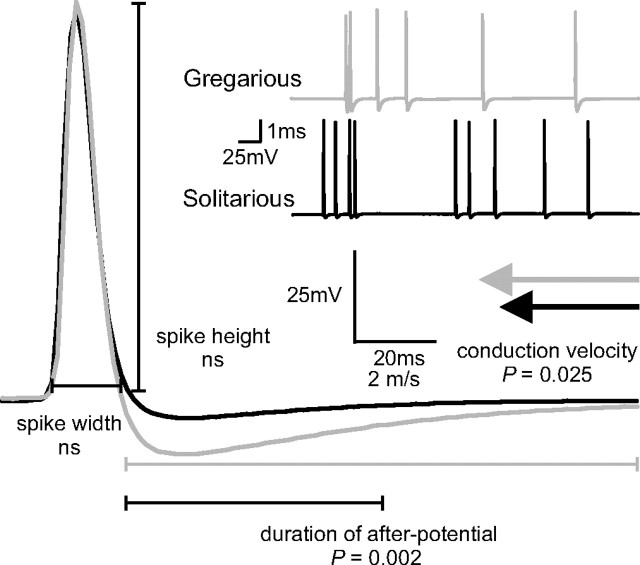
Figure 2.
Characteristics of DCMD measured using intracellular recording. A, Main figure, examples of a mean (30 sweeps) DCMD spike from a gregarious (gray) and solitarious (black) locust obtained from low firing rate (<10 Hz) conditions. The inset shows a section of the original recordings. Mean DCMD action potential width, height, resting potential, duration of hyperpolarizing afterpotential, and conduction velocity (gray and black arrows) were compared between phases.

