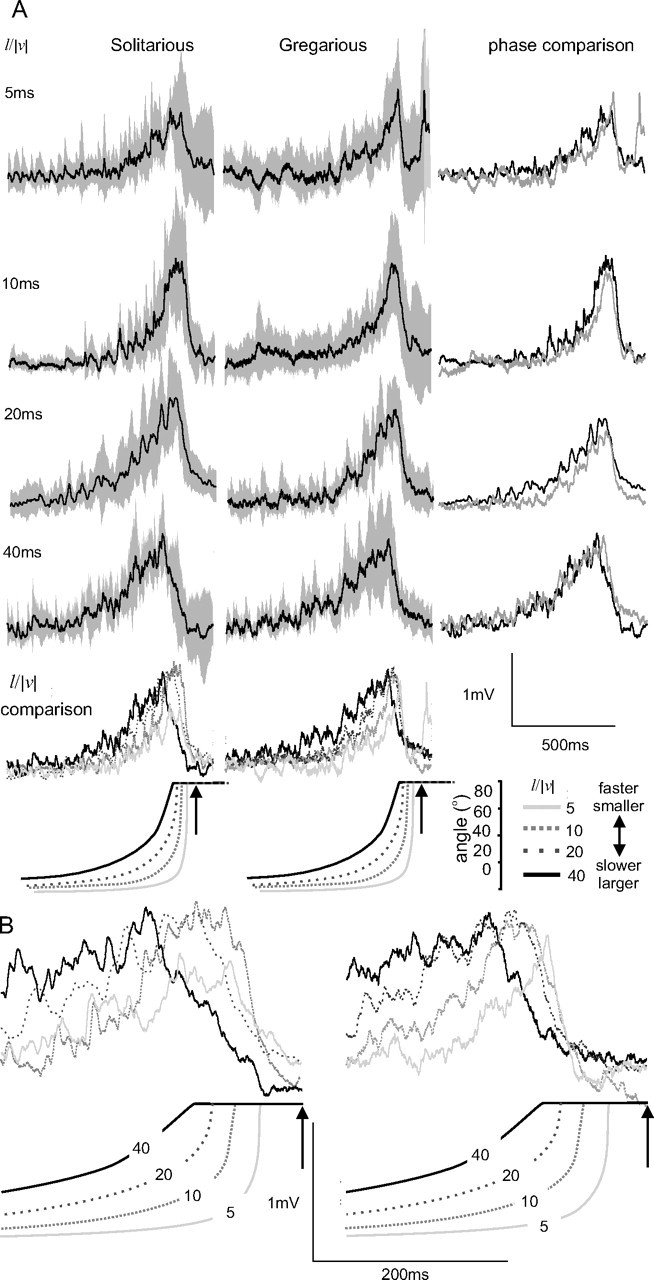
Figure 5.

A, Average (black lines) ± SD (gray bands) compound PSPs elicited by DCMD in FETi after stimulation of DCMD by looming objects of different l/|v| (n = 8 solitarious and 9 gregarious locusts). The right column overlays the mean responses of the two phases to each stimulus. Beneath are overlays of the mean responses to objects of different l/|v|. B, Overlays of the mean responses to objects of different l/|v| at an expanded time scale showing mean times of peak firing, as indicated by the numbers on the curves subtended by the expanding objects. The arrows indicate the time of collision.
